Welcome back,
Today, when I was creating threads on Inleo, I came across a thread where one of my threadmates shared his views on how Bitcoin might cross 120k dollars and even go further, maybe creating a new all time high as well. In this blog, I am here to share the technical analysis for Bitcoin and see whether or not Bitcoin will break this level. After reading this blog, you will probably be able to understand and maybe even predict the market movement for the coming days.
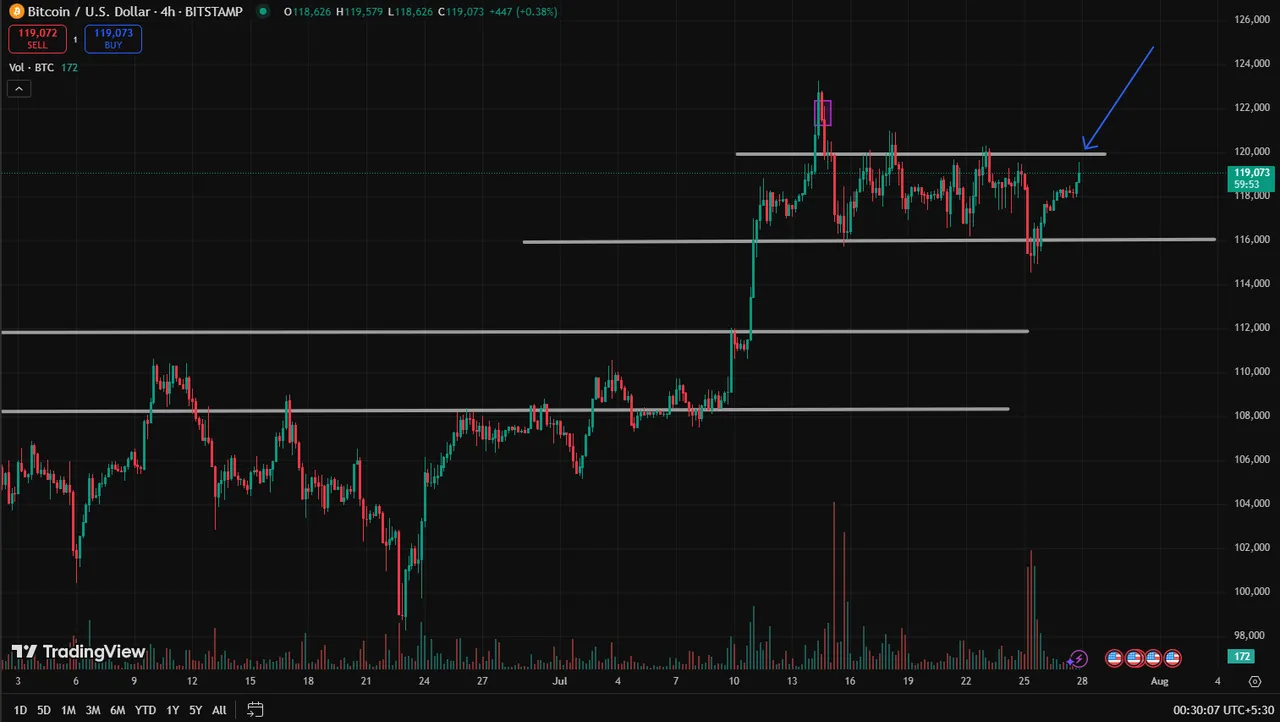
Chart at 4h timeframe
So let us look at the chart of Bitcoin for the four hour time frame in the screenshot below. There, you can see that I have created four important levels for Bitcoin price movement. We can focus on the one where you see the blue arrow, as that is what we need to look at because that is the resistance for Bitcoin, which it has been trying to break for the last few days. You can see in the screenshot below that there were a few instances where the Bitcoin price reached that resistance and got rejected from there.
Right now, Bitcoin price is once again testing it, and if we are able to break it, maybe we are going to go further to the upside. But there is a high chance, a high possibility, that we are not going to break it, and we are going to get rejected one more time before we actually break it.
Now what I personally think is that the market makers and whales are manipulating the price of Bitcoin very intensely. We can say this by looking at the chart, where we have seen around five rejections from this same resistance that I just mentioned. In the screenshot below, you can see that there are three arrows, and we are going to discuss these arrows in the later part. But for now, just observe them and see what you can understand by seeing them and maybe you can also tell me what you observed in the comments below.
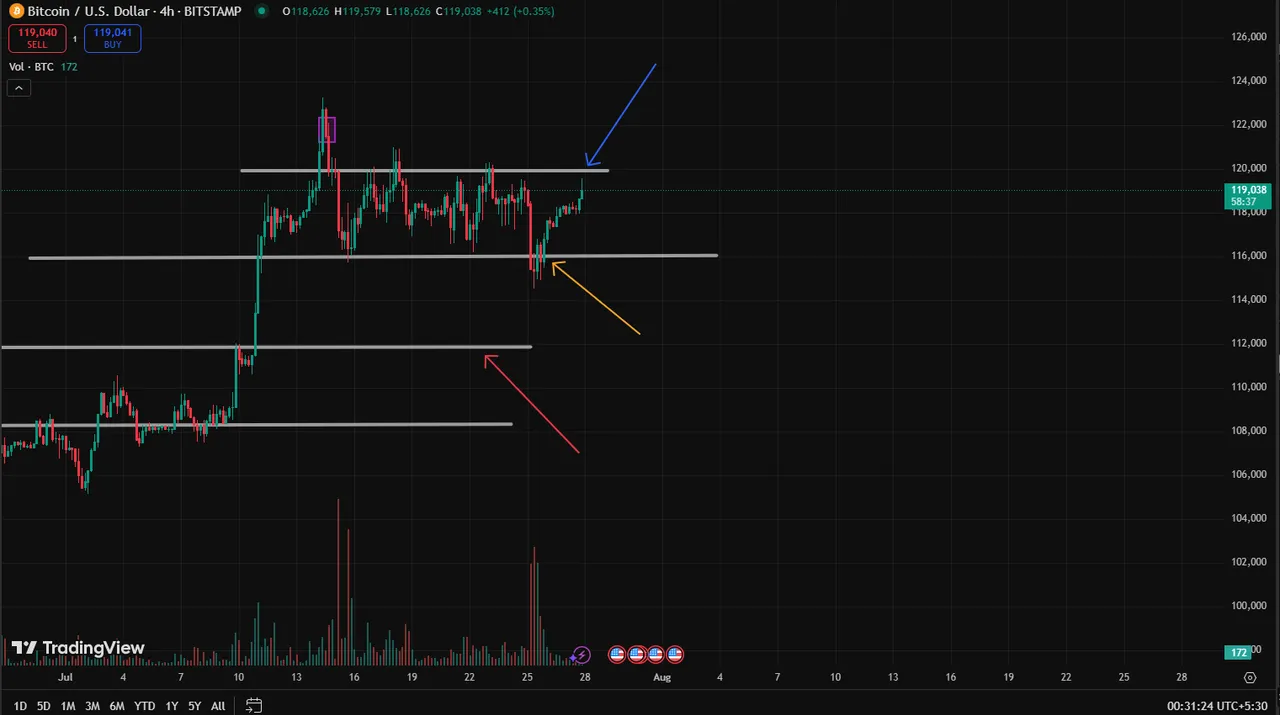
Now the three arrows that you can see in the screenshot above are the arrows that show the major levels for Bitcoin price. The yellow arrow is pointing towards the primary support which we must hold for Bitcoin to stay bullish. In case we break that support line where the yellow arrow is pointing, then there will be a huge fall in the price of Bitcoin, and we can go from the 115k dollar price to the 111k dollar price, which was initially the all time high for Bitcoin.
As I personally think that Bitcoin is yet to make its final move, the red arrow is pointing towards the support line which is the second support level for Bitcoin price. I believe even if we break the first support (which was shown by the yellow arrow), we are definitely going to bounce back from the second support and reclaim the primary support ( which will act as resistance once primary support breaks) as well.
Long vs Short positions in Bitcoin
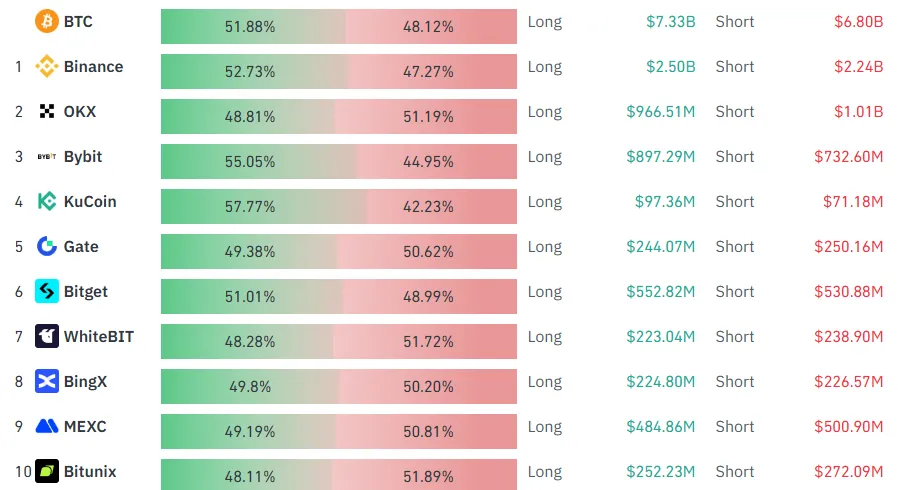
Now, apart from all this, let us look at the market sentiment and see how the future traders are reacting to the Bitcoin price. In the screenshot above, I have shared the data for the long versus short ratio. You can see that in most exchanges, the whales or future traders are actually indicating towards being bullish, as more than fifty percent of the positions are opened as long positions, and the short positions are less than fifty percent. But that is where the game changes.
That is where the retailers are being gamed. We look at this data and think that the market will definitely go upside, but to liquidate the long positions, there is a high chance that the Bitcoin price will fall and liquidate the traders who are betting on the higher side.
Rejection is possible
So, I think we are going to see a rejection. And though it is really difficult to predict the market when the ratios of long and short are close, in case the difference is too much, the prediction becomes easier. But for now, I think the ratios are very close, and still I think that there will be a rejection.
Historical data
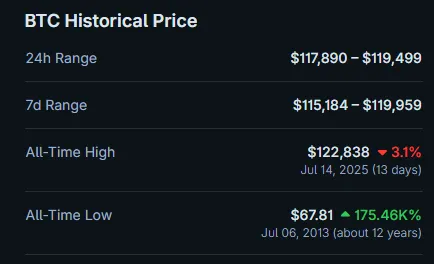
Now let us look at the historical data for Bitcoin price in the screenshot below. The all time high was set this month itself on July 14, at one 122k dollars. And if Bitcoin is able to break the resistance it is currently testing, then we are going to head towards the all time high directly. Or maybe there is a small resistance again at 121k dollars, but after that there is no resistance, and we will directly go and test the all time high for Bitcoin and eventually break it as well.
Conclusion
So let us conclude this blog and try to understand what the market might offer us in the coming days. We just discussed the three major levels for Bitcoin, where currently we are testing a resistance that has been a major resistance for Bitcoin for the last few days. Breaking it will result in a higher price movement, and eventually, we may reach the all time high as well. But since we have already seen Bitcoin getting rejected from that resistance multiple times, there is a high chance we will face rejection again and test the primary support line, which is marked by the yellow arrow. In the worst case scenario, we might also come down to test the second support line, which was marked by the red arrow.

So maybe Bitcoin is yet to break that resistance, and there will be more consolidation in the zone between the primary resistance and the support line. The rest of the decision is yours. If you want to trade Bitcoin in the futures market, then you are free to do whatever you want. But I am someone who stays away from futures. I am a spot trader. And as I always say, at the end of the day, it is your money, it is your investment, and you are the one who is going to take the decision for it.
I hope my analysis must have helped you in understanding the market movements that are likely to come ahead in the coming days. For this blog, I think I have written enough, and if you have anything in your mind, you can share it in the comment section.
Thank you and happy trading, everyone.
