Good day Hiveians!
Join me in analyzing the crypto markets!
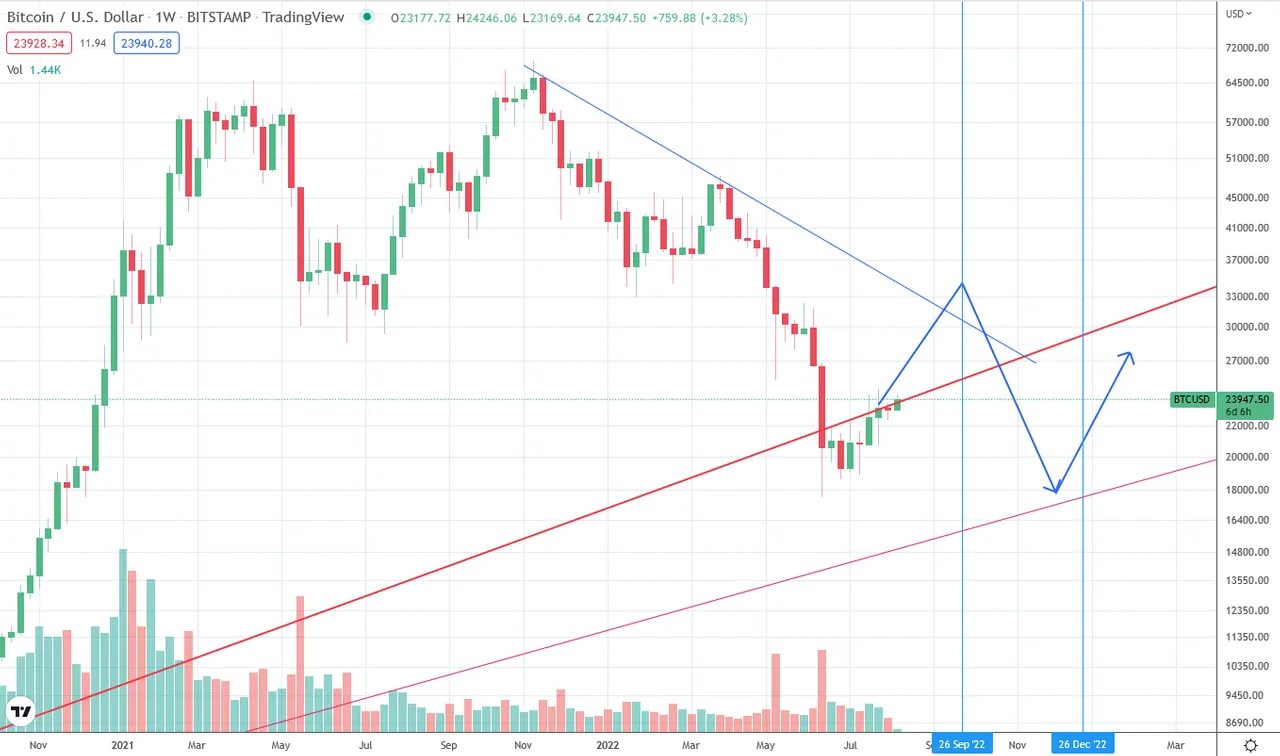
Yesterday we looked at the middle and long term scenarios for BTC
The idea is that we could be heading to 35k as seen in this chart:
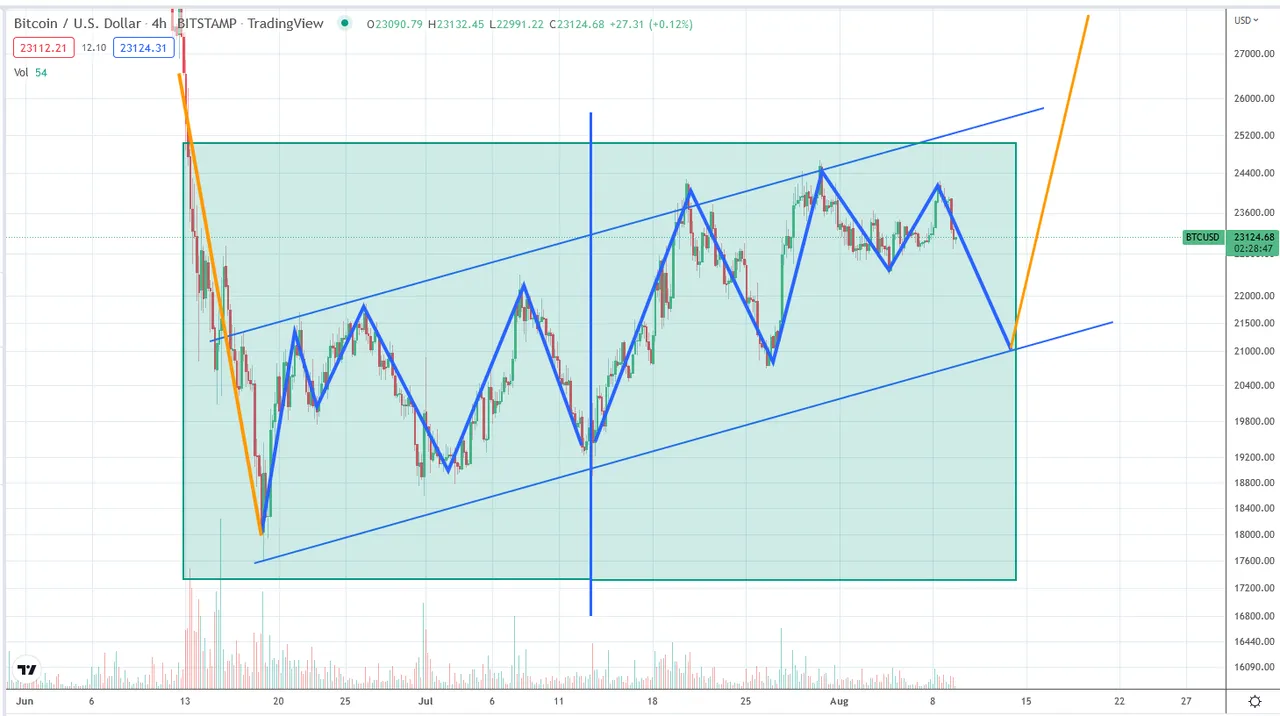
But today I want to talk about the close up picture as I have seen an interesting symmetry that I want to discuss here. This is the 4h chart:
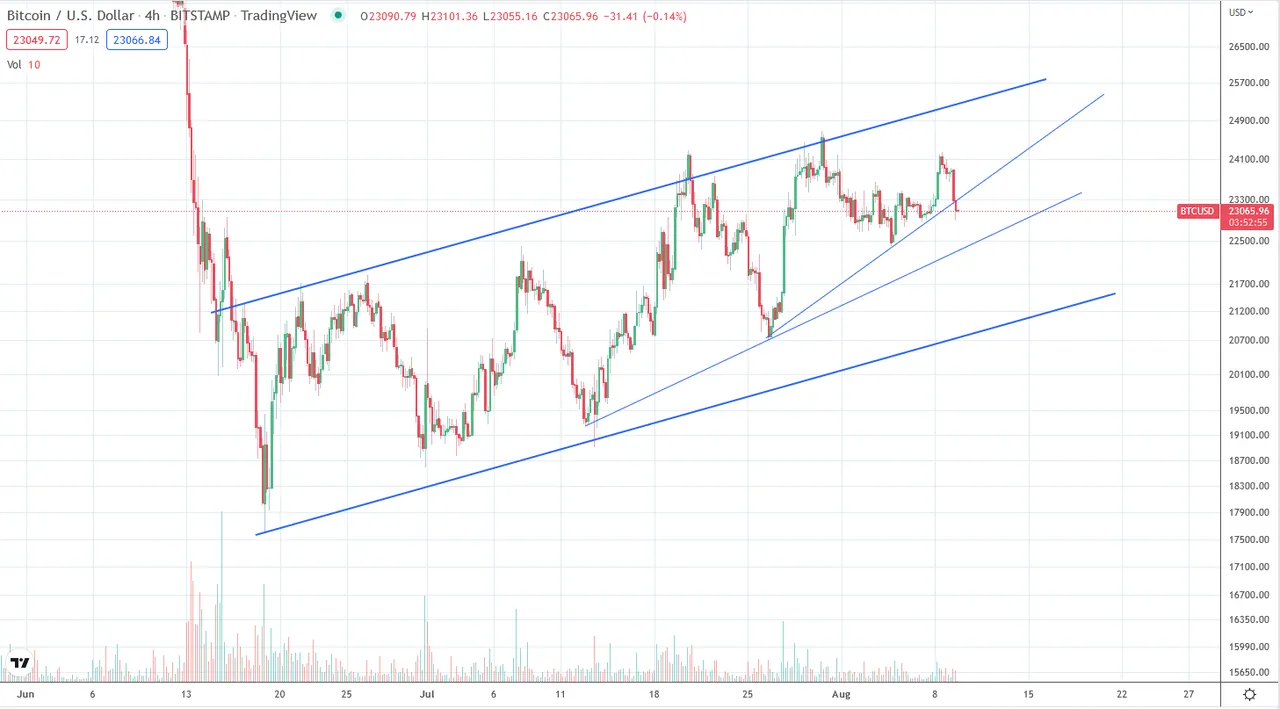
We have been once again in a parallel channel as so often after a bigger crash. But as youu can see the lows have been continually higher as seen with the finer trend lines. But within this pattern I think there is a symmetrical pattern which I want to bring attention to.
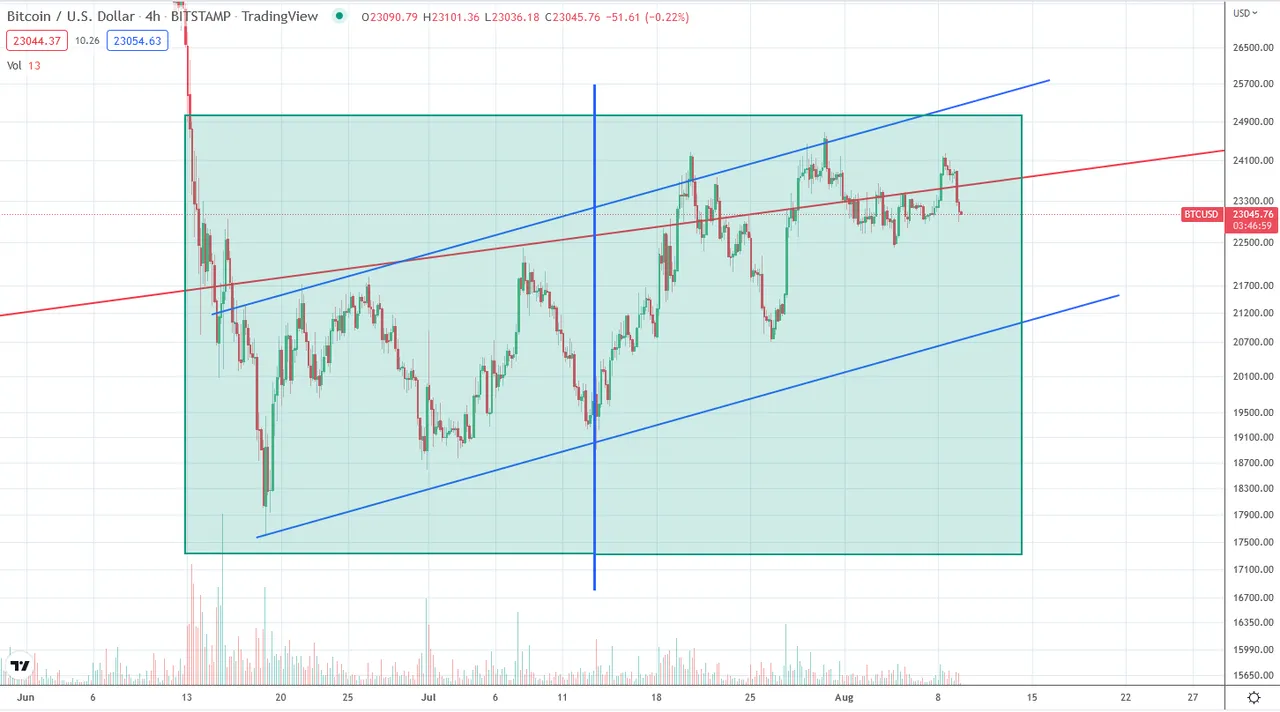
You can see the symmetry here with their counterparts divided by the vertical blue line.
And it's a bit better visible here.
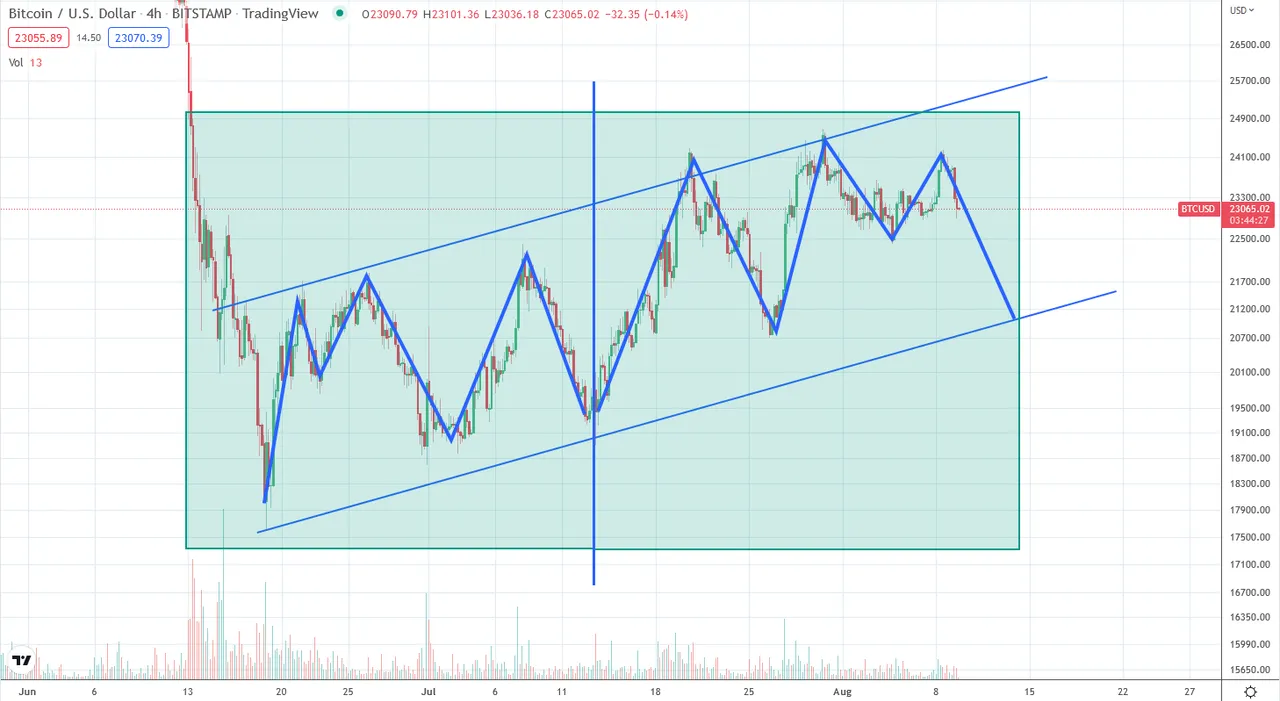
Notice that I did not just draw zig-zag lines; notice the double top at the side. What this suggests is that we could be heading lower to about 21k. But before you say "Didn't you say yesterday that we could go to 35k?!", let me finish my analysis ;)
After hitting 21k the pattern would suggest a reversal to higher levels (hence the 35k target):
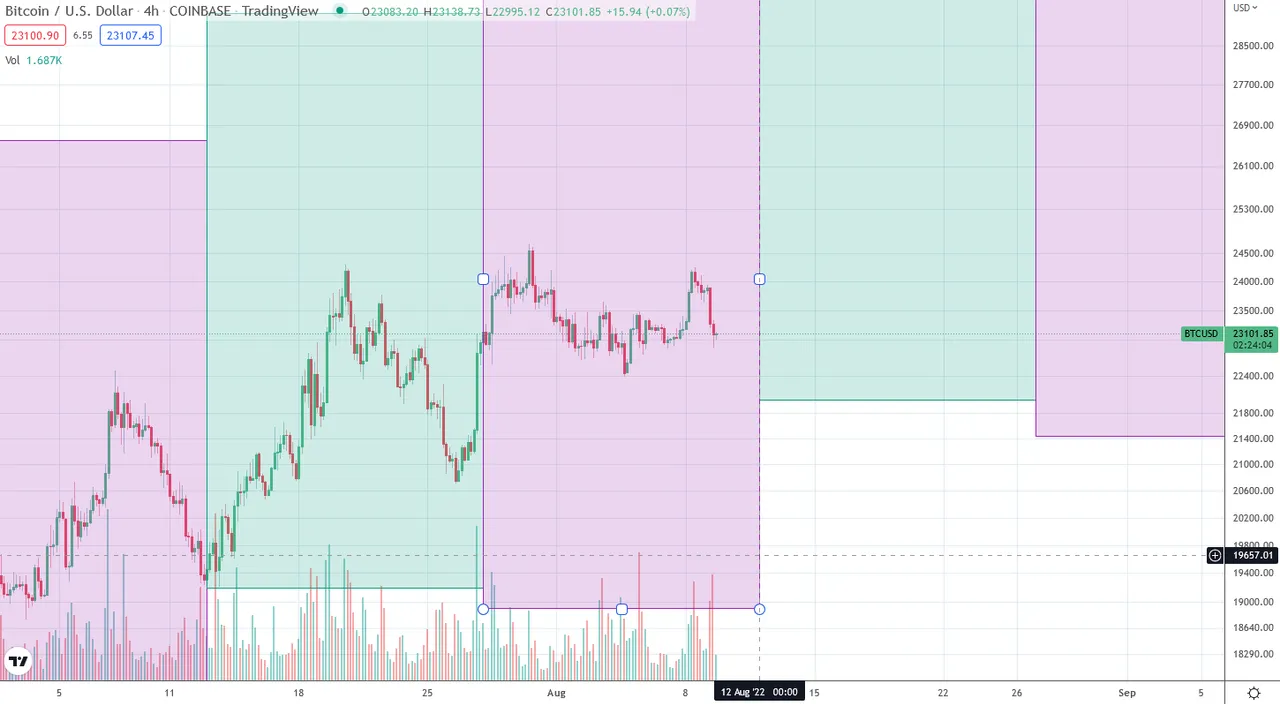
Heading lower in the next few days also makes sense from the Bitcoin-Moon Cycle connection point of view as the full moon is on August 12th. We then enter another 2 week "green" phase which would fit in line with the higher target:
As a general reminder: Please keep in mind that none of this is official investment advice! Crypto trading entails a great deal of risk; never spend money that you can't afford to lose!


Check out the Love The Clouds Community if you share the love for clouds!