Good day Hiveians!
Join me in analyzing the crypto markets!
Yesterday we looked at the Hive rally and wondered if it had already ended
In this post I pointed to two red lines for when I would consider the rally invalidated. This was the level of correction (in %) as well as the supporting trend line on the daily chart. So far these lines have not been crossed definitively.
Today I want to point out a very important metric that is rarely being used in TA. It is very powerful and also very simple: The Fib Ratios. While there are several ways in which one can draw fib ratios into a chart, the Fib Channel is extremely good for predicting the bottom of a correction. More importantly, it works on all scales and can therefore be used for all of the subwaves as well as the main waves of a price movement.
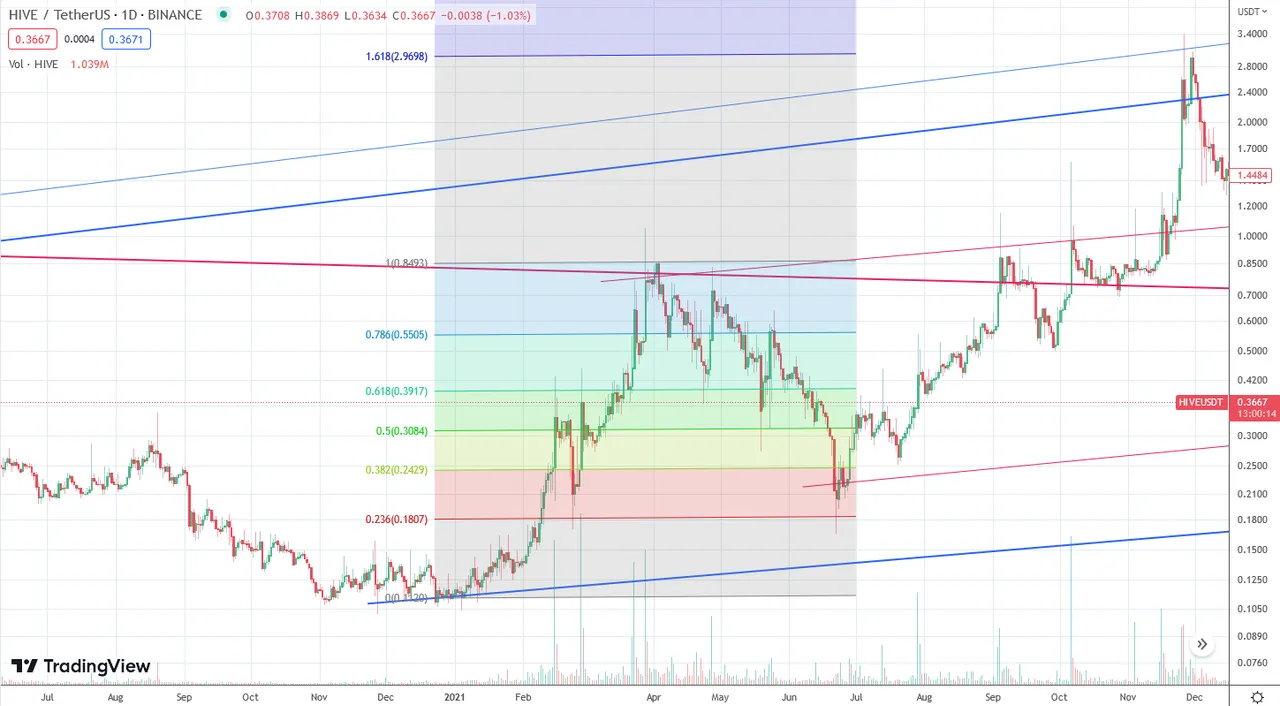
Let's first look at subwaves
Here we see a subwave running up to about 42 cents and then a correction to 16 cents. It's important to note that when using this technique there are two ways of looking at it: the wicks or the candles or both. I will use a combination here. In this case the wick touched the 0.236 fib ratio before heading higher again:
And two more examples. You can see that I used the wicks as well the candles here:
It is important to do this only for the impulse waves. It does not work very good for when price overall goes into a corrective mode.
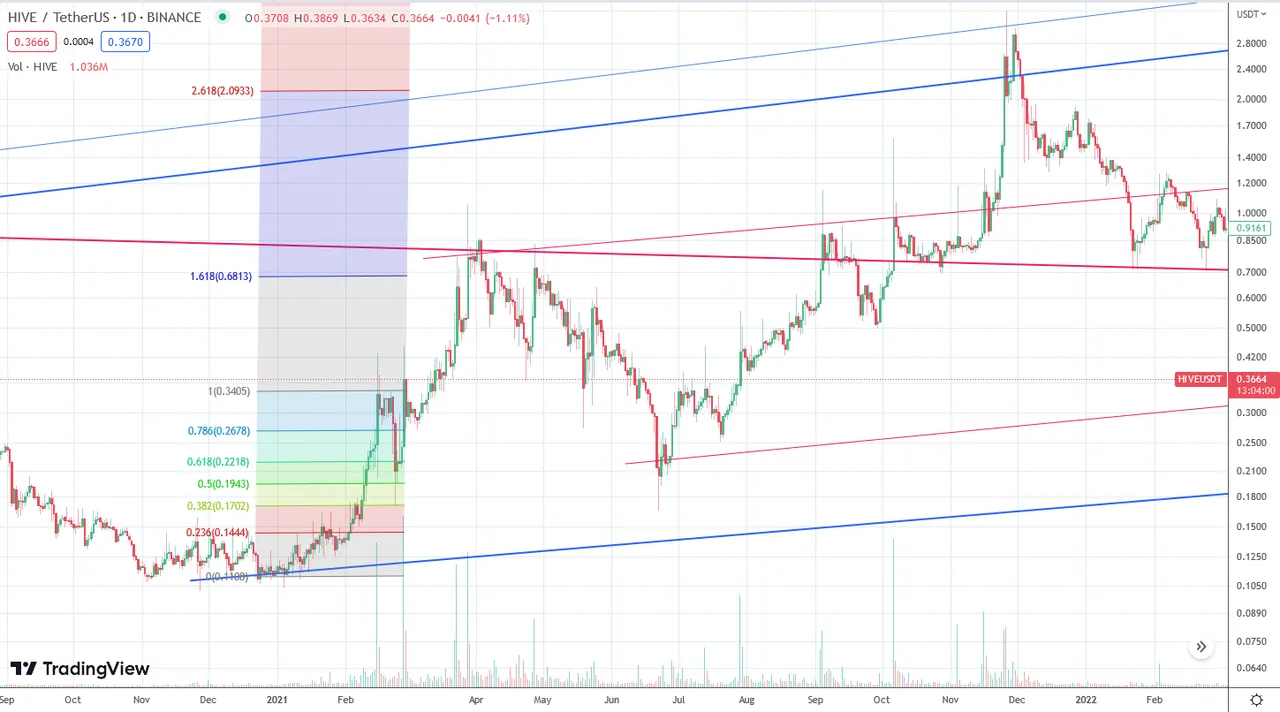
The bigger waves
Now the bigger subwaves. The bigger wave in 2021 went to about $1 and then headed back to around 16 cents. This is in the red area of the 0.236 ratio:
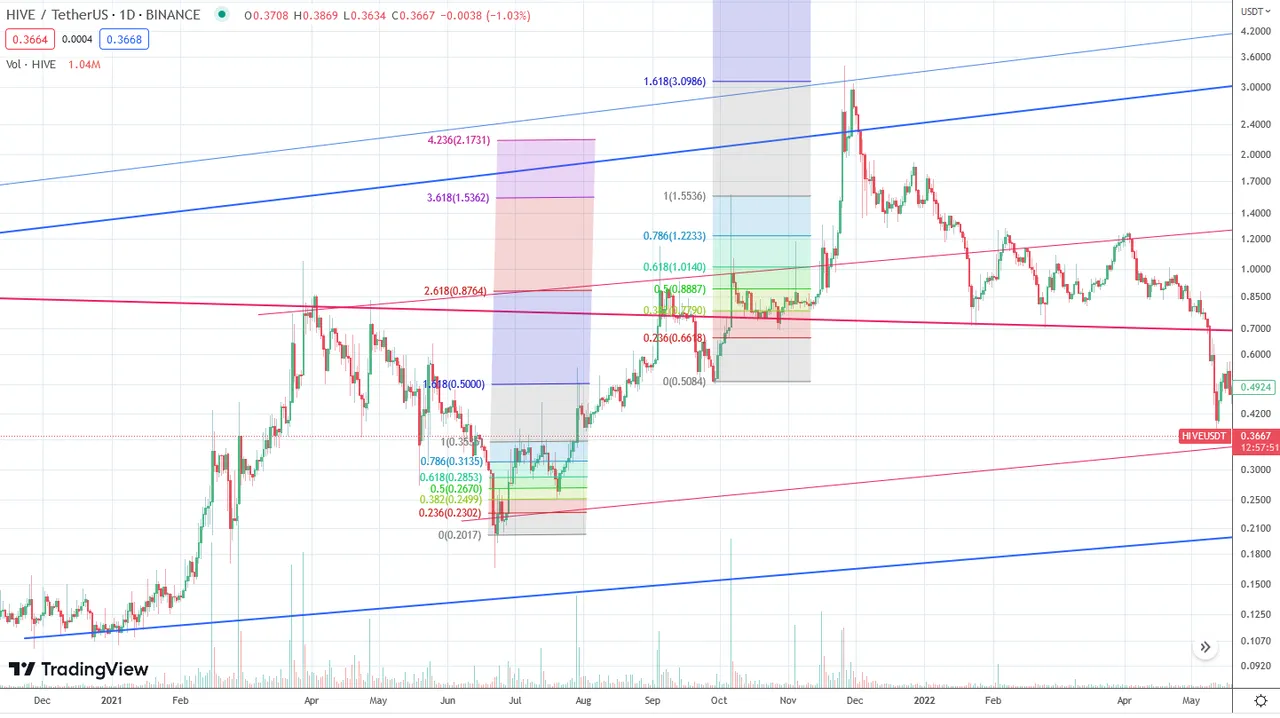
The biggest fractal we have is the whole wave starting from 2021 and ending (?) in 2022/3:

Here we see that it played out perfectly: the whole wave went to around $3.4 and then back to 25 cents which is exactly at the bottom of the 0.236 fib ratio.
Conclusion
Somehow I forgot to look at the fib channel for Hive, especially for the largest wave. Seeing that price corrected back to exactly this level where historically it has always recovered I am quite confident that 25 cents was indeed the bottom. If so, the rally I talked about will continue, but at a slower pace.
If we apply this technique to the current subwave we also see that price will probably continue downward until about 32-34 cents before recovering. I think this time price will only touch the top red area since it also coincides with a trend line here and should find support:

As a general reminder: Please keep in mind that none of this is official investment advice! Crypto trading entails a great deal of risk; never spend money that you can't afford to lose!


Check out the Love The Clouds Community if you share the love for clouds!