Good day Hiveians!
Join me in analyzing the crypto markets!
Perhaps you have heard about the moon cycle Bitcoin connection
Here I want to have a closer look as I never really took it too seriously. But it seems that there is something to it! While it would be hard to think of causal factors to explain this connection, sometimes the universe is just more mysterious than we think... or perhaps it has something to do with money flow that correlates with a 2 week rhythm... If you have an idea, let me know!
First we will plot BTC/USD chart and overlay the moon cycle. The red dots are new moons and the blue dots are full moons. The idea is that Bitcoin peaks when there is a new moon and bottoms with a full moon. If so, this should be easy to spot in the chart, and it is!
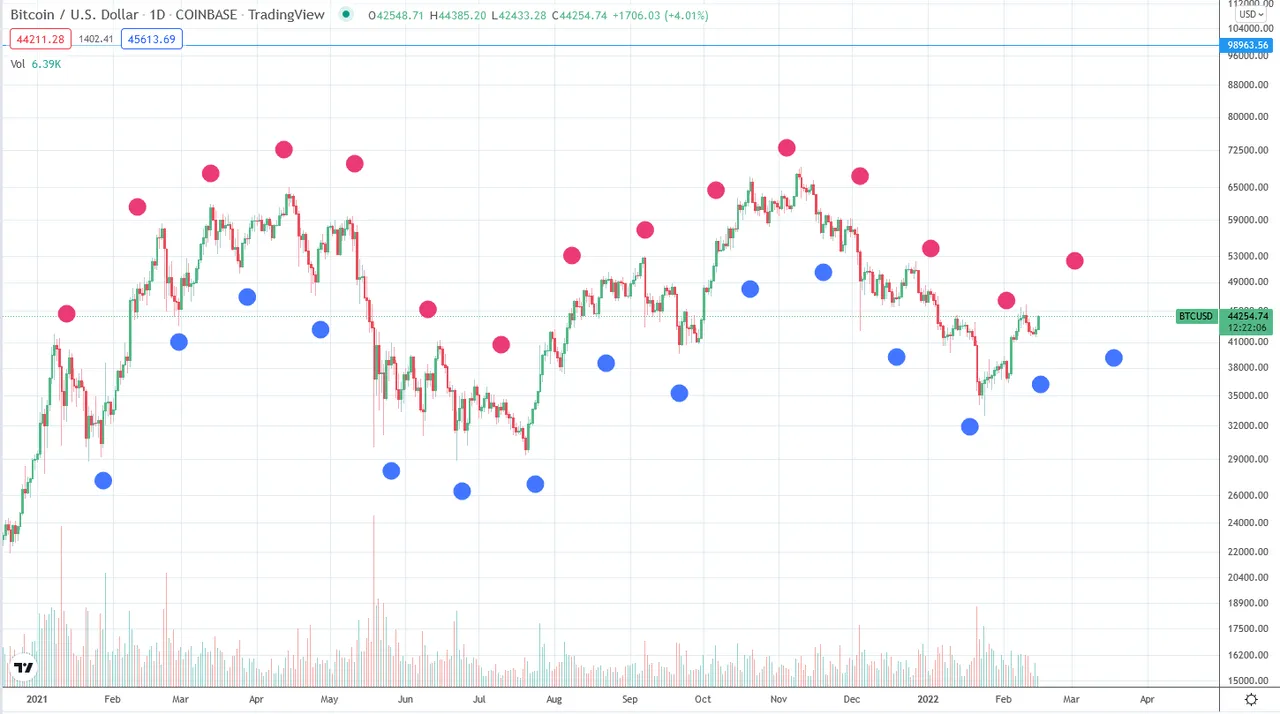
The chart shows this correlation almost perfectly. There are only few exceptions... Interesting! Let's have a close up view and fill in some areas that show how the price should develop within the 2 week time span (from full to new or vice versa).
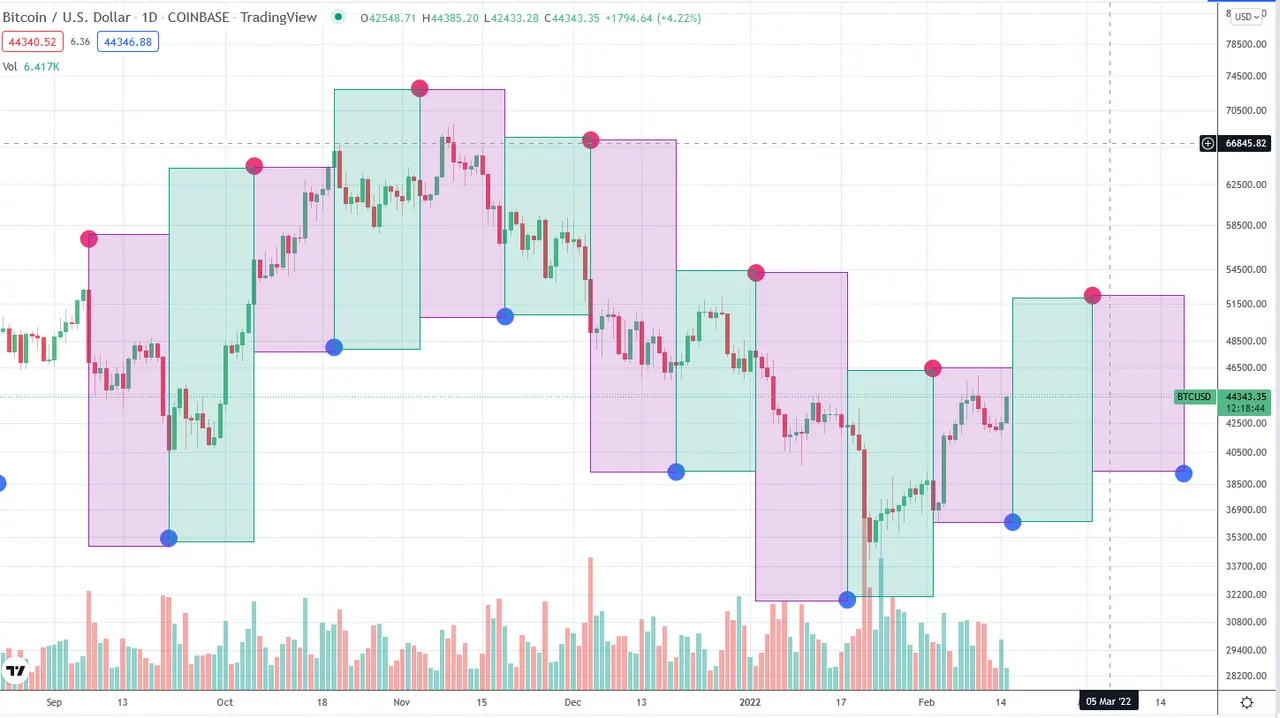
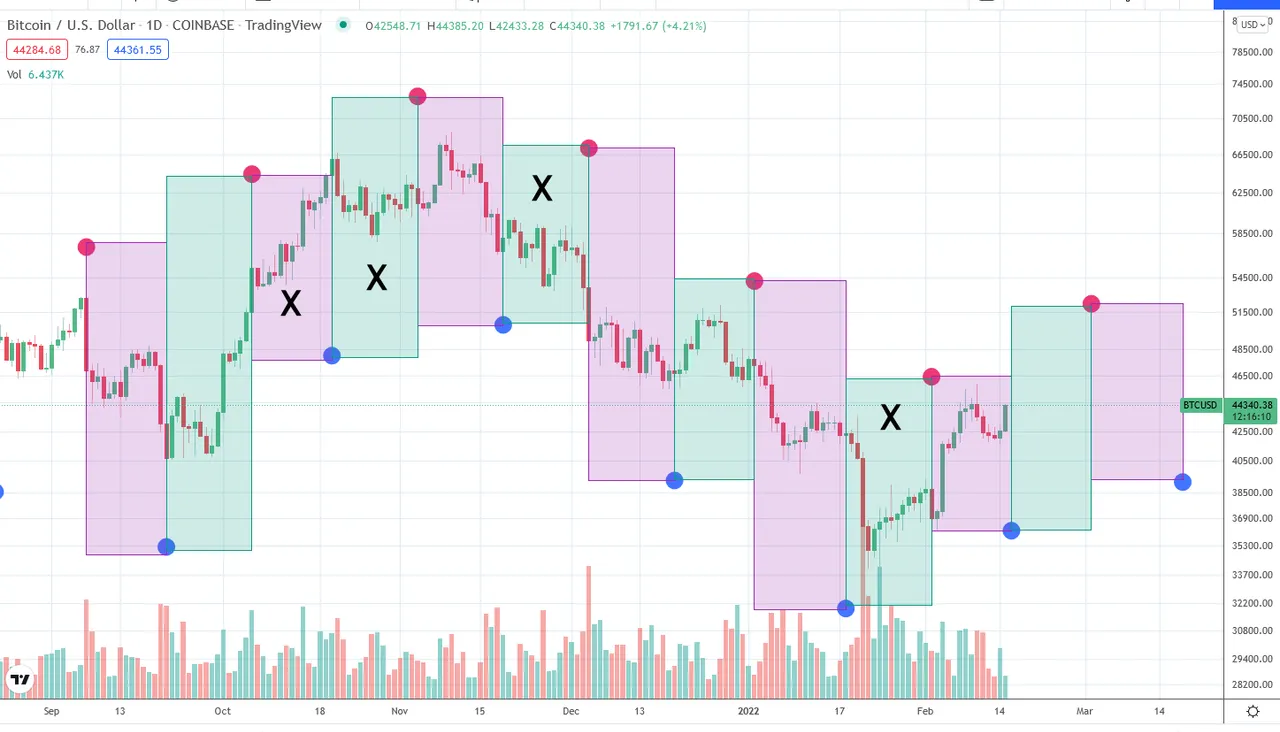
This looks, as expected, very good as well. Almost all areas are showing the expected price trend. There are a few exceptions which I have marked with an "X". In all, there are 4 areas that show an opposite trend.
But if we look at the chart closely, we can see that there seems to have been some smaller delays for the price to "catch up". For instance, take November: the green area should show an upward trend, but ends negatively. However, the spike happened about 5-7 days later. If we allow for these slight delays, the main pattern holds very well. In fact there seems to be only two areas in which the expected trend was "wrong". A third one, however, seems to be currently happening as prices should have fallen instead of risen over the last 2 weeks.
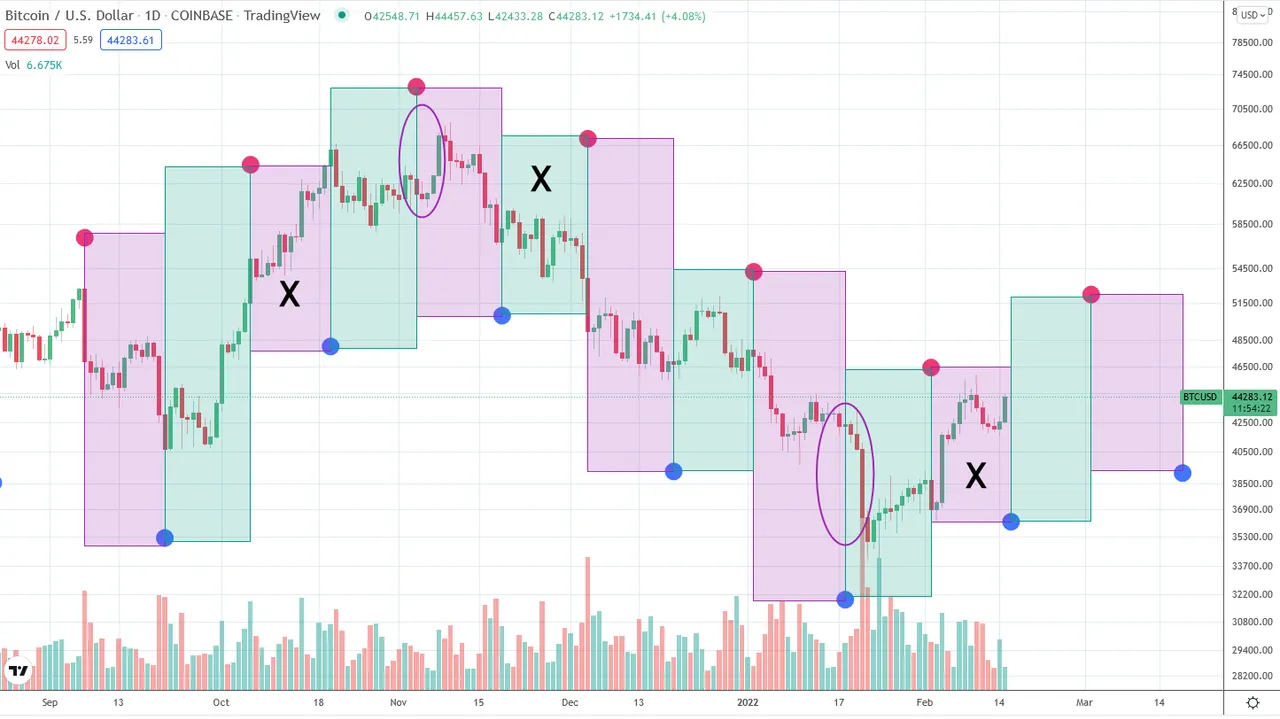
This result is rather surprising to me as the correlation is remarkably (!) good. As far as I know nobody really knows why this correlation exists. Do you have an answer? But for TA the reason often is not so important as we can use this pattern for our analysis. Of course it is only tentative ass we have to be careful to avoid a deterministic interpretation. But so far this technique has successfully predicted a future price trend over 70% of the times (the correct areas and Xs in this chart 11/3=0.27%; and 1-0.27=~73%), so we should definitely keep this tool available.
tagging @edicted as he so often refers to this (and I didn't believe it ;)
As a general reminder: Please keep in mind that none of this is official investment advice! Crypto trading entails a great deal of risk; never spend money that you can't afford to lose!


Check out the Love The Clouds Community if you share the love for clouds!