Good day Hiveians!
Join me in analyzing the crypto markets!
TradingView just updated their data for DXY
The new data going back to the 60s changes my former TA quite radically. The main premise (a rising DXY) still holds and is even strengthened with this new data.
Why care about DXY? Well, the dollar$ has been in the news quite often lately. And mostly people talk about the decline of the $. There are actually many valid reasons for this. The main one perhaps being the decline of the PetroDollar that goes along with a new multi polar world order in which energy is not bought or sold in $ anymore (at least exclusively).
The paradox however, is that the DXY has since then mainly gone up. The reason for this is to me somewhat unclear (although I haven't looked too deeply into it so there might be a good explanation relating to market mechanics etc.). From a TA perspective it is now even clearer that the DXY can almost certainly only go up.
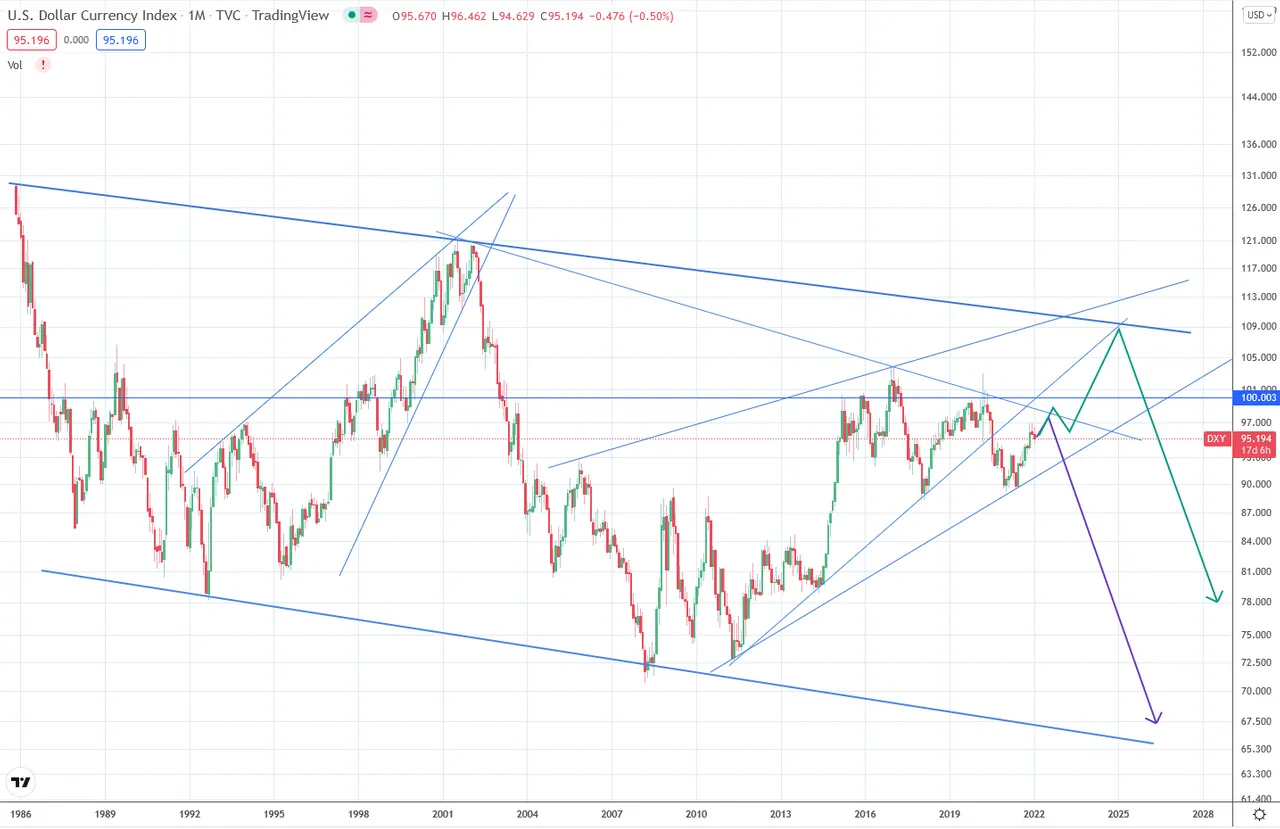
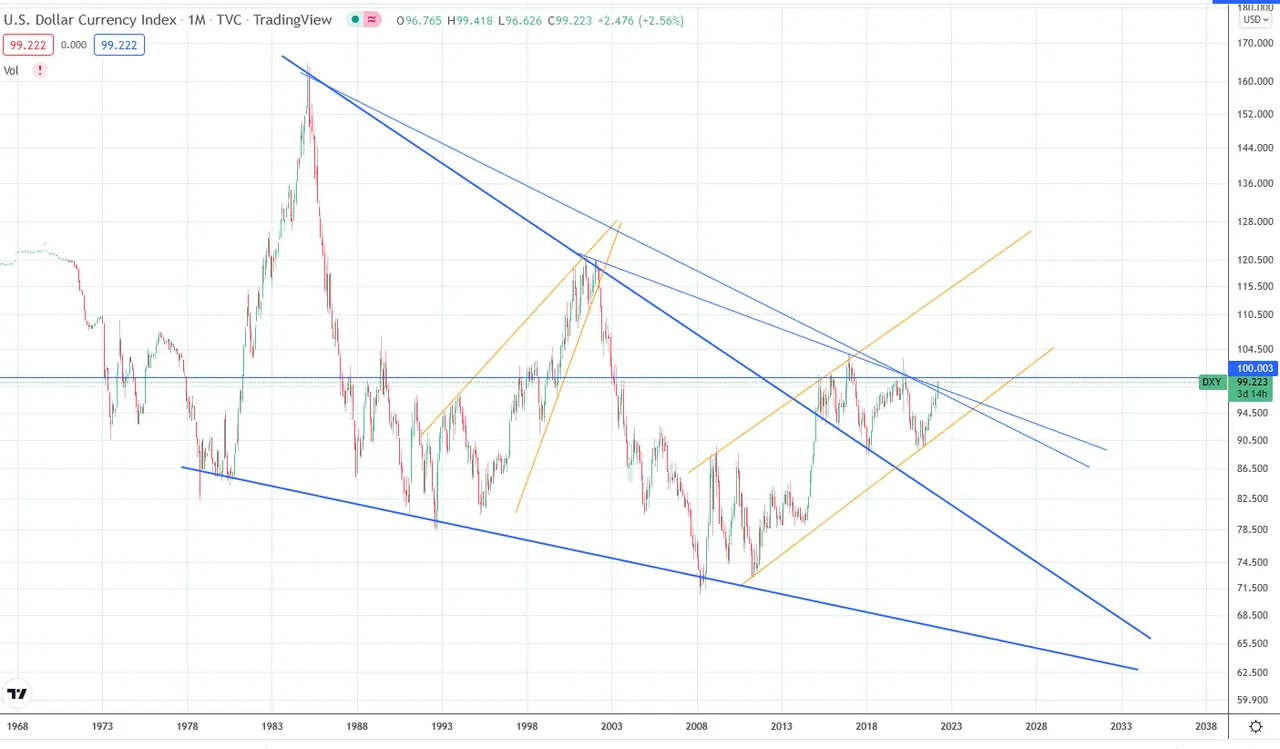
Last time I presented this chart in which I expected the DXY to continue upwards and then decline very strongly. But I didn't have all the data.
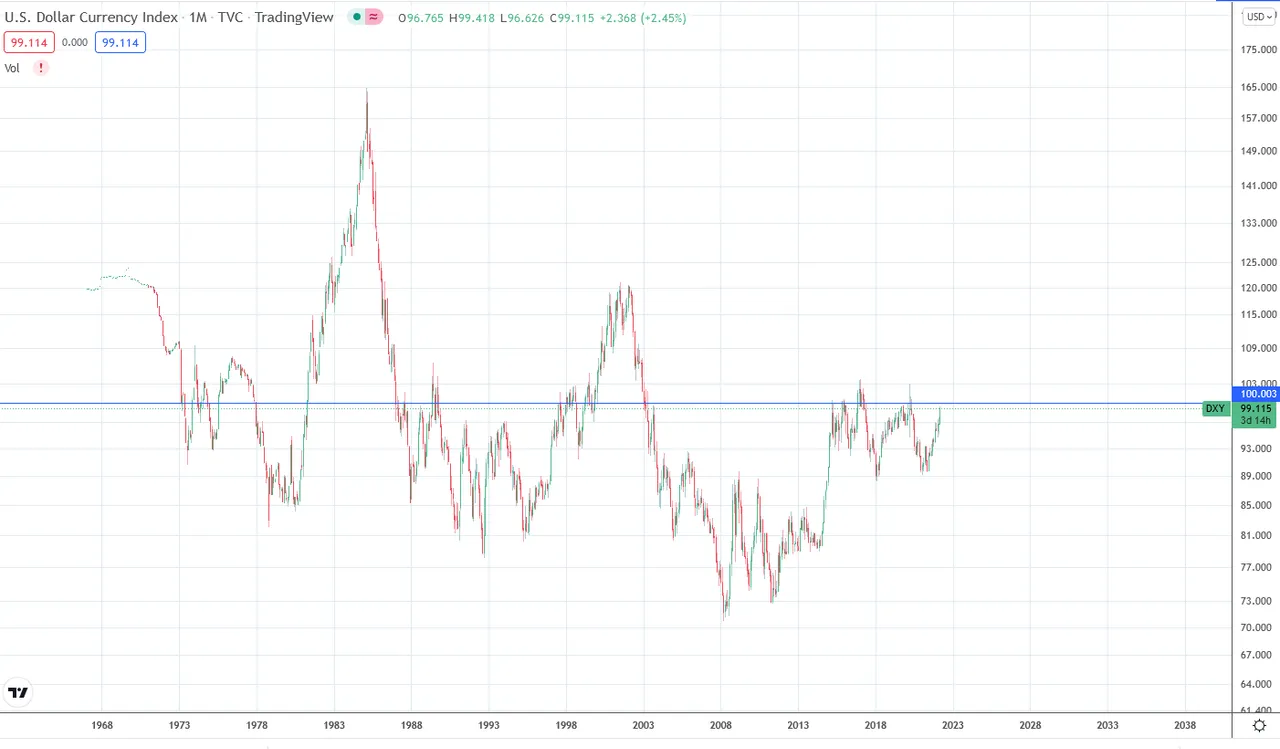
The new data is a real eye opener. We can see that the ATH was much higher at around 160. We can use this to analyze the chart and come to much better results.
First let's draw in some basic trend lines. We see a strong bottom going back to 1978! as well as a former top c ommecning with the peak of the 80s. This top was "broken" in 2015. This insight was previously hidden with the limited dataset and is tremendously important. This means that the former top was breached and has turned into a supporting trend line. It was retested in 2018 and held. Since then we has higher lows which is bullish.
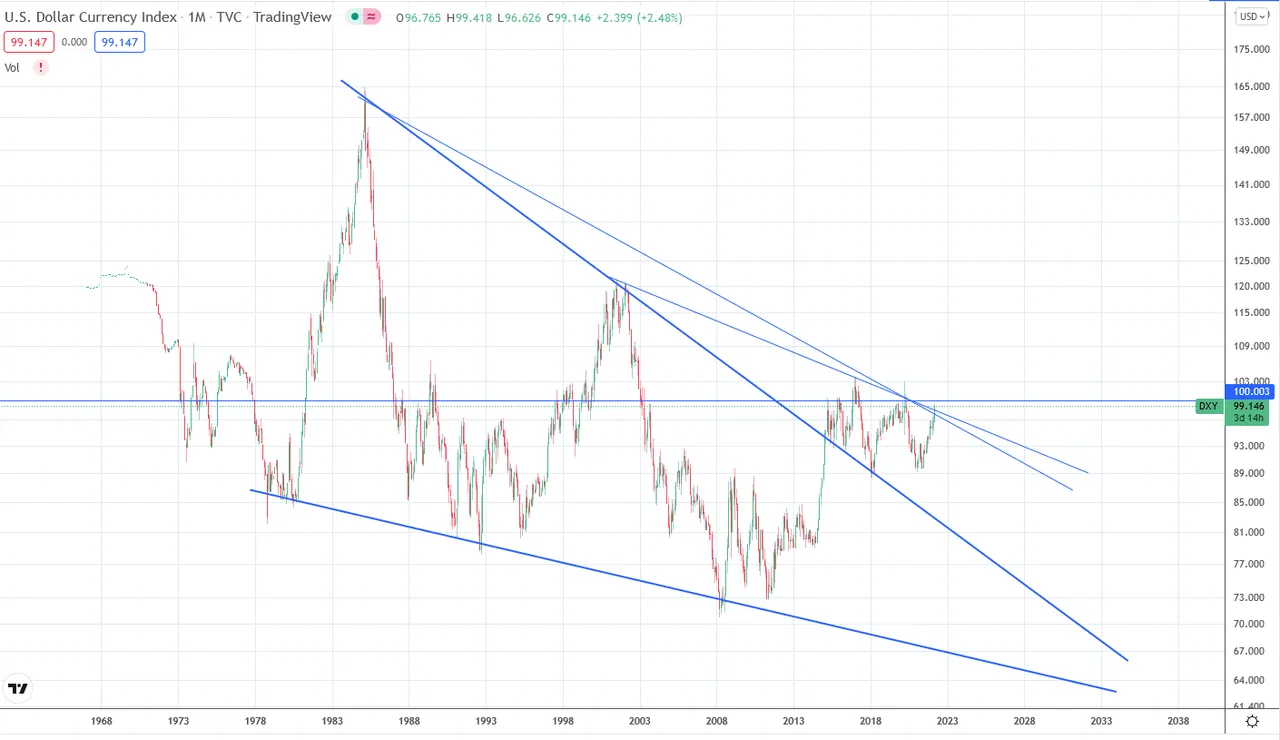
The new resistances come from the previous highs and can be seen in the thinner blue lines at the top. As you can see they are both being breached as well. There are now several weeks of confirmation on this which is still not enough to say what will happen definitely, but it currently looks as if it will continue its upward push.
I will lay out two scenarios again.
First is the bearish one which finishes with the current level at around 100. This would "work out" as the 3 wave pattern (see post above) has been fulfilled for the current set. But on the meso scale it seems to be lacking (more on this in the second scenario). A more bullish scenario seems more likely currently.
The second bullish scenario would see the index moving much higher still. First we can see that the upward movement might not have been completed as the yellow trend lines suggest a further upward potential. Different to the 90s, this would be a parallel channel with a high of ~120 in 2023-2025. This would also be confirmed with the breach of the current resistances of the former highs (see thinner blue trend lines).
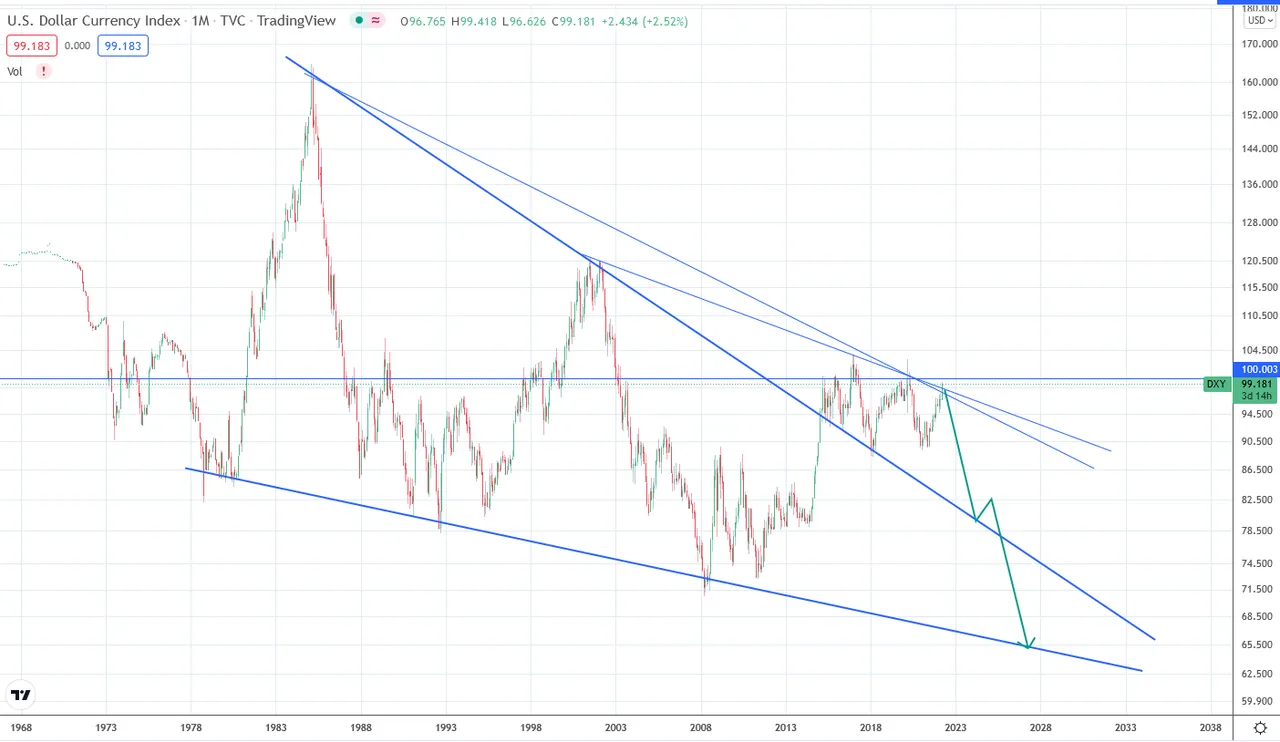
This is more evident in the next chart. We see the 3 wave pattern and a high at ~120 which would also establish a macro parallel channel.
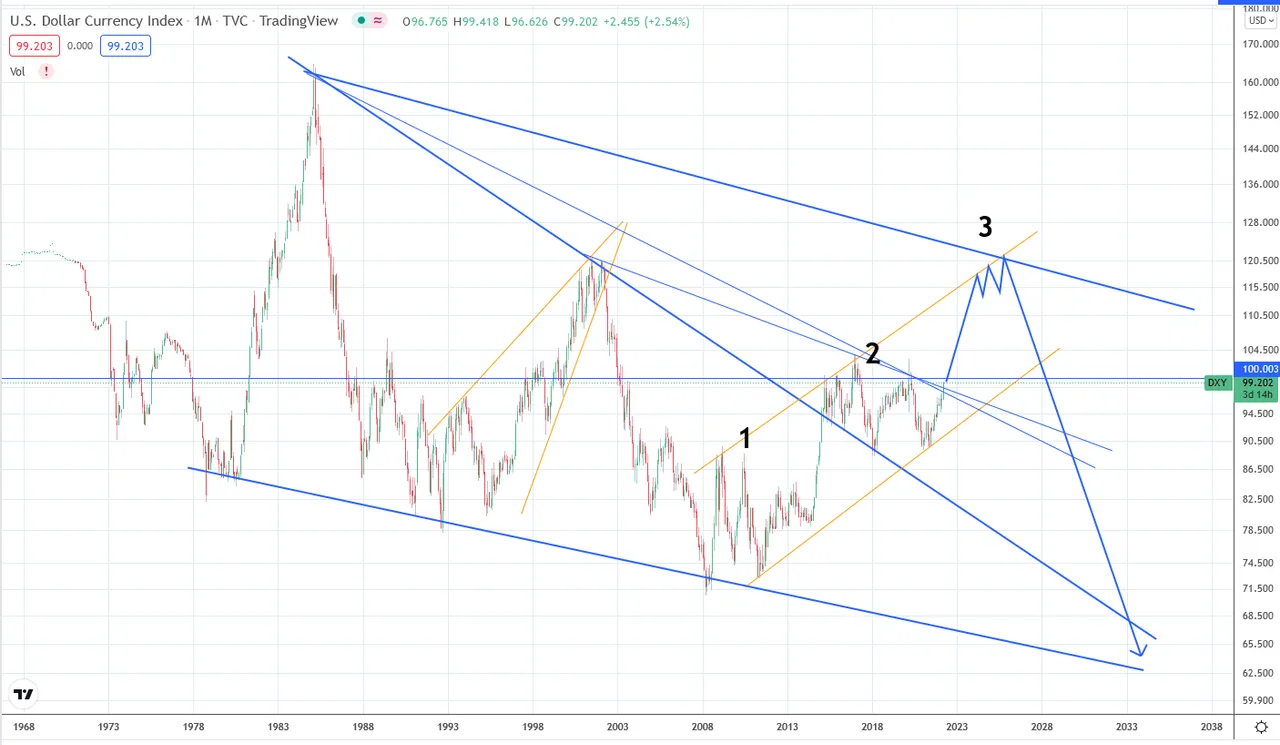
What would happen next is obvious: a massive devaluation of the $. This would be a macro correction taking us all the way back to the long established support at around ~60! I have little doubt that this is coming considering what is taking place in the restructuring of the world currently. But perhaps the surprise is that despite all of this, the DXY will first continue to rise before crashing.
As a general reminder: Please keep in mind that none of this is official investment advice! Crypto trading entails a great deal of risk; never spend money that you can't afford to lose!


Check out the Love The Clouds Community if you share the love for clouds!