Applying Wyckoff to the 1H BTC Chart
The Wyckoff Method for accumulation and distribution phases is a great tool to know in which moment of these we are.
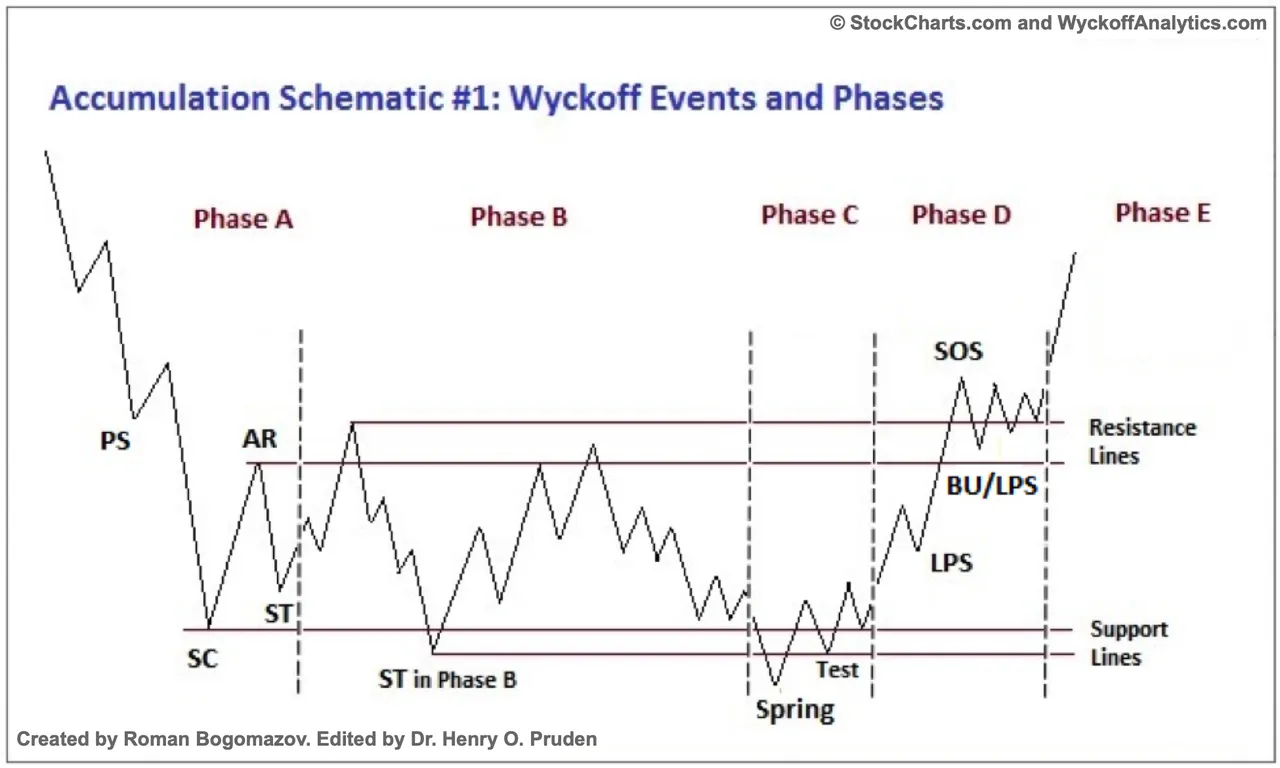
In the case of BTC, during the last month, a tedious accumulation interval has been drawn in which I would say that we can faithfully apply the following diagram.
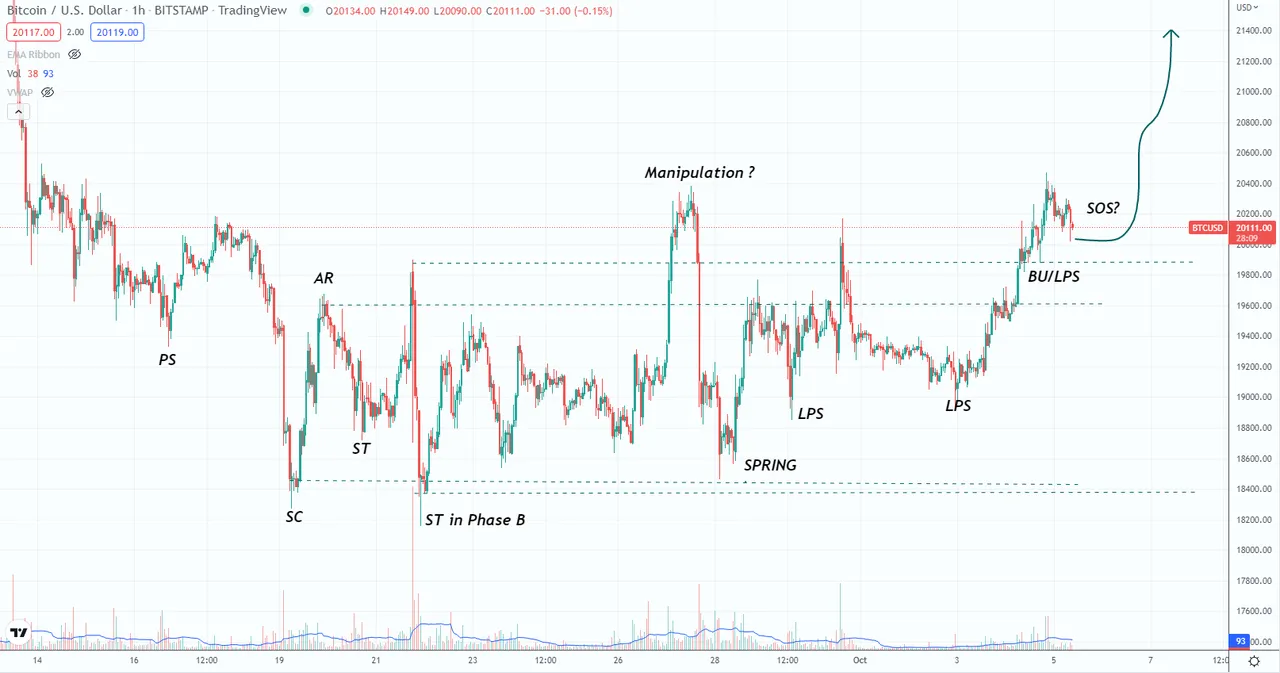
As you can see, it seems that we are in the high resistance of an accumulation phase, the SOS point refers to "sign of strength, a price advance on increasing spread and relatively higher volume. Often a SOS takes place after a spring, validating the analyst's interpretation of that prior action.**
All the components of the accumulation diagram have been taking place during the last weeks, in addition, there is one important thing, the volume begins to grow again with which the break of the resistance of $20,300 could trigger a sustained Rally towards $22,000 where most of the upward imbalances are found.
I don't know if this scenario is a continuation but I think it reaffirms the hypothesis that the months of October are normally good for BITCOIN and the crypto market in general.
In addition, rumors are circulating that the Central Banks, FED, ECB etc... are thinking of relaxing the growth of interest rates given that the rate of increases they were taking seems to have exacerbated the crisis more than it smoothed it out.
*Disclaimer: This is just my personal point of view, please, do your own assessment and act consequently. Neither this post nor myself is responsible for any of your profit/losses obtained as a result of this information.