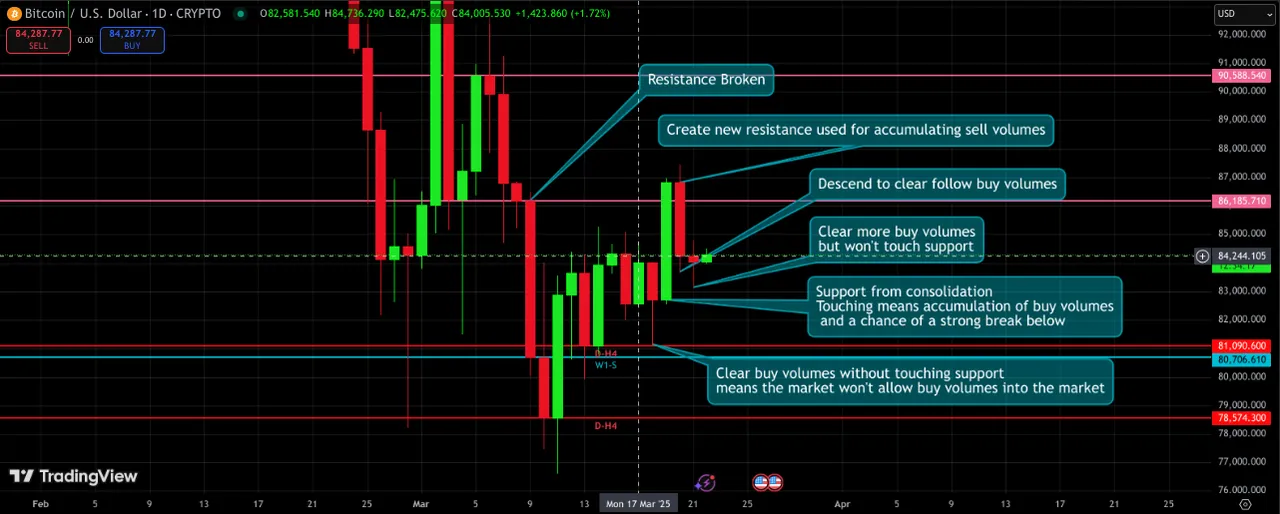
Let's look at the daily candle in the Bitcoin charts. We do see that the market has created a higher support from its completed reversal and then pushing down clearing buy volumes but without touching another support. This means that the market are not allowing buy volumes into the market and it keeps clearing buy volumes from FOMO while also creating a higher resistance as it goes up before clearing down and then ascending up to accumulates sell volumes from those resistances before pushing further and was able to break every resistances on it way up which means the market keep accumulating sell volumes to which means it also wants to keep ascending. Now is the time to buy since it is still clearing buy volumes but no touching support which means it still has a chance of ascending, but do be careful in case it drops abruptly accumulating buy volumes and crash down before coming back up again because this is what the chart always do.
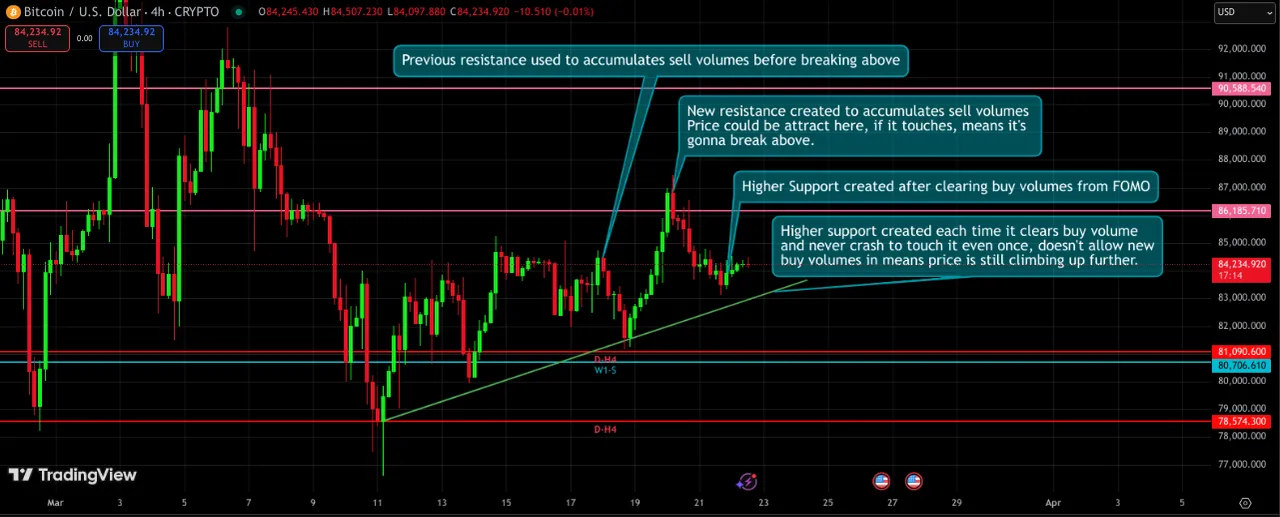
We can see that every time the price breaks resistance(close above resistance), it comes back down to clear off FOMO buy volumes before climbing back up again. This shows that the chart isn't allowing new buy volumes into the market but keeps on accumulating sell volumes which means the market is gonna break above from current price action. There isn't much to analyze except for this point which clearly shows the market doing something, and since we know that the market is eliminating buyers from the market and allowing sellers in, we should be in the opposite from most of the trader to win.
My theories may not be right most of the time, but I am also forward testing these theories myself to confirm and to master it in order for it to work in my hands. Like Bruce Lee said, :"Fear people who train 1 move 10,000 times".