
En este post semanal te explico mi interpretación del mercado de criptomonedas, principalmente Bitcoin. Podrás encontrar un análisis detallado de mis perspectivas, planificación e ideas para posibles operaciones.
- Análisis Técnico de los gráficos DIARIO, 4 HORAS, 1 HORA o 15 MMINUTOS
- Zonas de Interés.
- Posibles movimientos operables.
- Ideas y reflexiones sobre lo que espero para mi operativa durante las semanas.
- Mi plan de acción.
IMPORTANTE: Esto no es un intento de predicción o anticipación de los movimientos, sino una planificación objetiva para reaccionar a los posibles diferentes escenarios que puedan darse durante mi semana de trading y los comparto contigo esperando que te sean de utilidad. Recuerda que el trading es una actividad riesgosa donde puedes perder tu dinero así que ten mucho cuidado con las decisiones que tomas.
GRÁFICO DIARIO
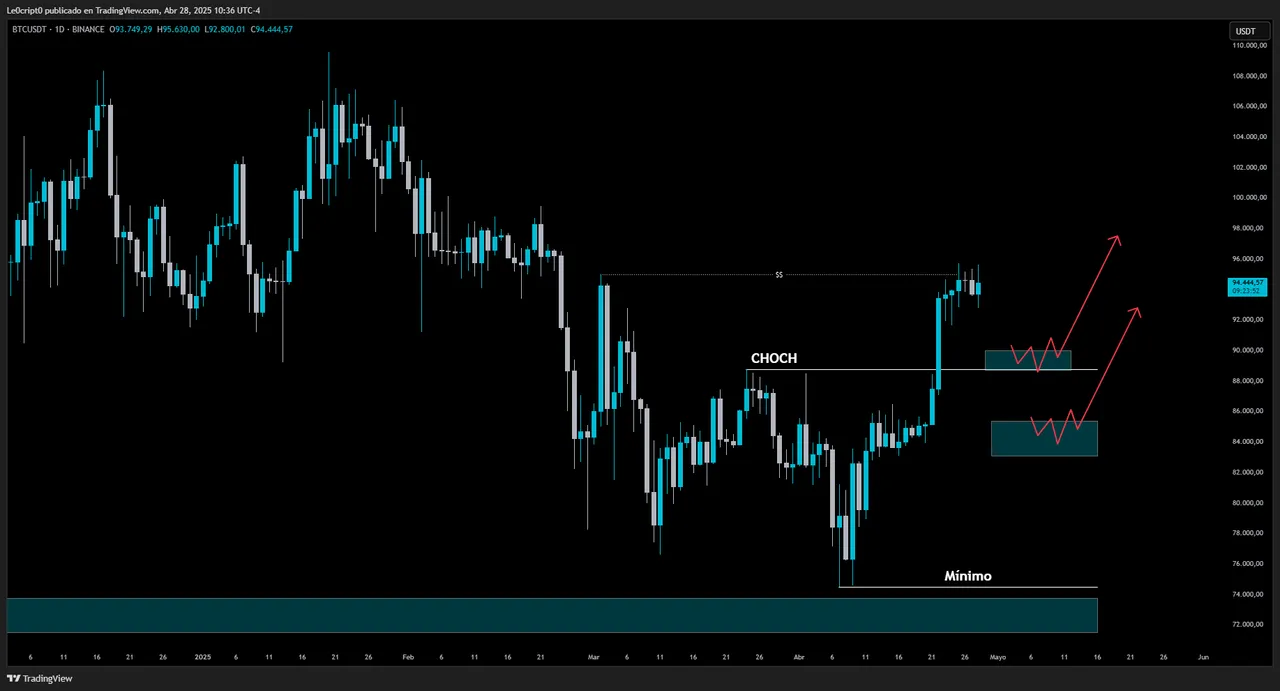
En GRÁFICO DIARIO Finalmente sucedió lo que todos queríamos y Bitcoin superó los 90k llegando hasta los 95k aproximadamente en un movimiento con fuerza y volatilidad. Dicho movimiento rompe los máximos anteriores y marca el regreso de la tendencia alcista en altas temporalidades.
De todas formas la subida no será eterna y debemos estar preparados para aprovechar posibles retrocesos mis 2 zonas de interés son entre los 89k-90k donde confluyen el máximo anterior y el nivel psicológico de los 90k. Si en un retroceso el precio se detiene y consolida esa zona como soporte podemos comenzar a construir posiciones ahí. La siguiente zona si los 90k no resisten está entre los 80k-85k donde confluyen un área de acumulación de volumen, el 50% de Fibonacci y nuevamente el nivel psicológico de los 80k.
Una caída por debajo de esos precios me parece poco probable pero no imposible así que es importante estar preparados por si sucede.
GRÁFICO DE 4 HORAS
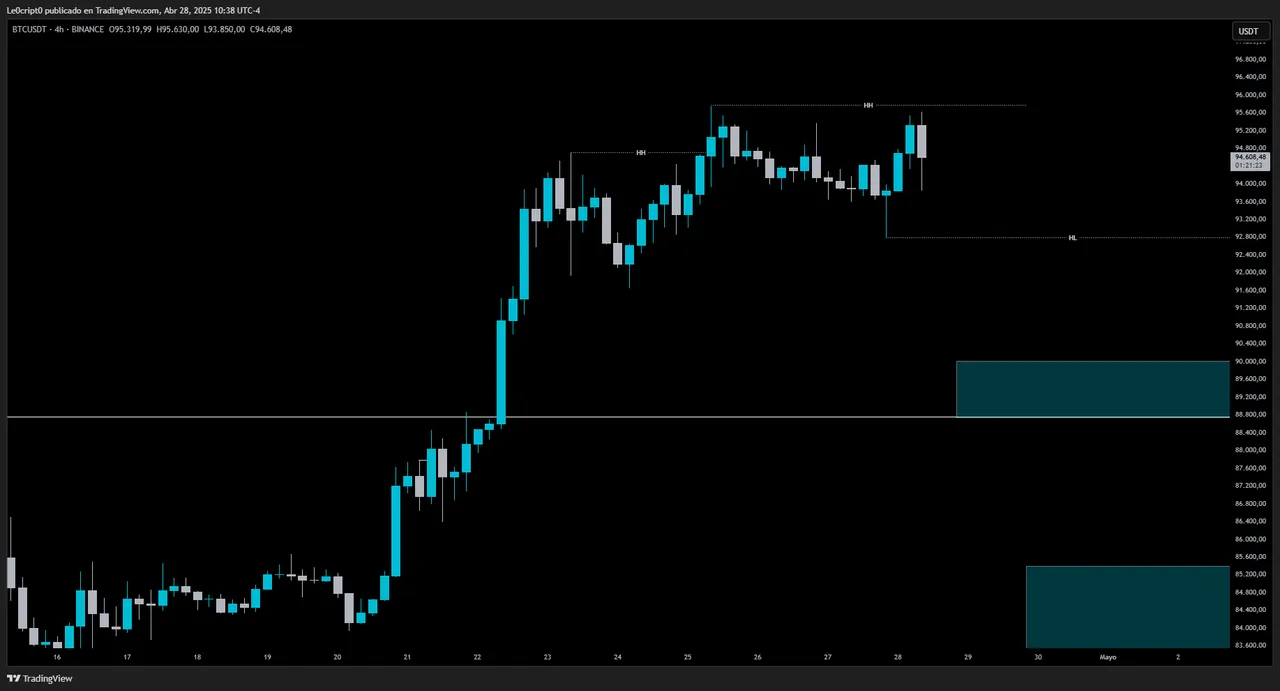
En H4 no hay mucho para analizar de momento, el precio viene de una fuerte expansión alcista y se encuentra consolidando, además que los fines de semana suele haber poca volatilidad así que la interpretación es practicamente la misma que para el gráfico diario.
GRÁFICO DE 1 HORA/15 MINUTOS
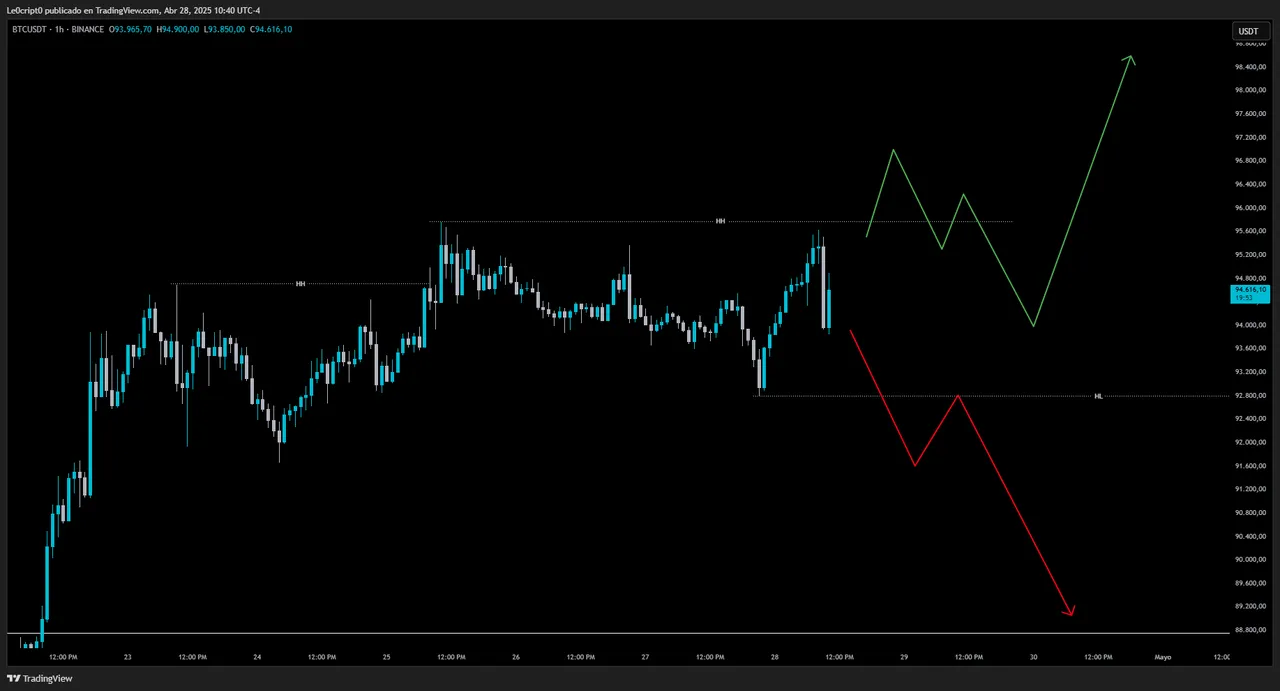
En gráfico horario si podemos ver una estructura alcista bastante clara que se estuvo formando durante el fin de semana aunque mucho menos fuerte y volátil que el movimiento que nos trajo hasta aquí.
En la imagen están marcados los puntos estructurales clave, máximos y mínimos relevantes que podemos usar como referencia para tomar decisiones en el corto plazo. En el punto que nos encontramos ahora mismo estamos en tierra de nadie por lo que no es ideal para tomar ninguna operación, siempre debemos intentar entrar en los extremos del movimiento para obtener una relación riesgo beneficio óptima.
Si rompe al alza pues tendremos una continuación del movimiento alcista que podría llevarnos a recuperar los 100k y si cae por debajo de los mínimos marcados debería comenzar un retroceso que nos lleve a las zonas que ya definimos en el grafico diario.
Reflexión Final
Gracias por llegar hasta aquí. Recuerda que este análisis es parte de mi propio proceso de aprendizaje y crecimiento como trader, y lo comparto contigo con la intención de aportar valor. Si algo de esto te sirve para mejorar tu perspectiva o tomar mejores decisiones, entonces ha valido la pena. Si quieres que añada nuevas monedas a estos análisis déjame saber cuales en los comentarios y les puedo dedicar una pequeña sección en estos artículos.
Nos vemos la próxima semana con otro análisis.
¡Mucho éxito y buen trading!
ENGLISH
In this weekly post I explain my interpretation of the cryptocurrency market, mainly Bitcoin. You will find a detailed analysis of my perspectives, planning, and ideas for potential trades.
- Technical Analysis of the DAILY, 4-HOUR, 1-HOUR or 15-MINUTE charts
- Zones of Interest.
- Potential tradeable movements.
- Ideas and reflections on what I expect for my trading during the upcoming weeks.
- My action plan.
IMPORTANT: This is not an attempt to predict or anticipate movements, but rather an objective plan to react to the different possible scenarios that might unfold during my trading week, which I share with you hoping it will be useful. Remember, trading is a risky activity where you can lose your money, so be very careful with the decisions you make.
DAILY CHART
In the DAILY CHART finally what we all wanted happened: Bitcoin broke above 90k, reaching around 95k in a strong and volatile move. This movement breaks previous highs and marks the return of the uptrend in higher timeframes.
However, the rise won't last forever and we must be prepared to capitalize on possible pullbacks. My two zones of interest are between 89k–90k where the previous high and the psychological 90k level converge. If during a pullback the price stalls and consolidates this area as support, we can start building positions there. The next zone, if 90k does not hold, is between 80k–85k where a volume accumulation area, the 50% Fibonacci retracement, and the psychological 80k level all converge.
A drop below these levels seems unlikely, but not impossible — so it's crucial to be prepared just in case.
4-HOUR CHART
On the H4 chart, there's not much to analyze for now. Price comes from a strong bullish expansion and is currently consolidating. Also, weekends usually bring low volatility, so the interpretation remains practically the same as the daily chart.
1-HOUR/15-MINUTE CHART
On the hourly chart, we can indeed see a clear bullish structure that formed over the weekend, although much weaker and less volatile than the previous move that brought us here.
In the image, I’ve marked the key structural points — important highs and lows — that we can use as references for making short-term decisions. At the point where we are now, we’re in "no man’s land," which is not ideal for taking any trades. We should always try to enter at the extremes of movements to achieve an optimal risk-reward ratio.
If it breaks upwards, we could see a continuation of the bullish move that could take us back towards 100k. If it breaks below the marked lows, it should start a pullback towards the zones we already defined on the daily chart.
Final Thoughts
Thanks for making it all the way here. Remember, this analysis is part of my own learning and growth process as a trader, and I share it with you hoping it adds value. If any of this helps you improve your perspective or make better decisions, then it was worth it. If you want me to add new coins to these analyses, let me know in the comments, and I can dedicate a small section to them in future articles.
See you next week with another analysis.
Wishing you lots of success and good trading!
Nota: Este post fue escrito originalmente en español y traducido al inglés con la ayuda de ChatGPT.
Todas las imágenes utilizadas fueron creadas en Canva y son capturas de pantalla tomadas desde TradingView.
Note: This post was originally written in Spanish and translated into English using ChatGPT.
All images used were created in Canva and are screenshots taken from TradingView.