En este post semanal te explico mi interpretación del mercada de criptomonedas, principalmente Bitcoin. Podrás encontrar un análisis detallado de mis perspectivas, planificación y ideas para posibles operaciones.
- Análisis Técnico de los gráficos DIARIO, 4 HORAS, 1 HORA o 15 MMINUTOS
- Zonas de Interés.
- Posibles movimientos operables.
- Ideas y reflexiones sobre lo que espero para mi operativa durante las semanas.
- Mi plan de acción.
IMPORTANTE: Esto no es un intento de predicción o anticipación de los movimientos, sino una planificación objetiva para reaccionar a los posibles diferentes escenarios que puedan darse durante mi semana de trading y los comparto contigo esperando que te sean de utilidad. Recuerda que el trading es una actividad riesgosa donde puedes perder tu dinero así que ten mucho cuidado con las decisiones que tomas.
GRÁFICO DIARIO
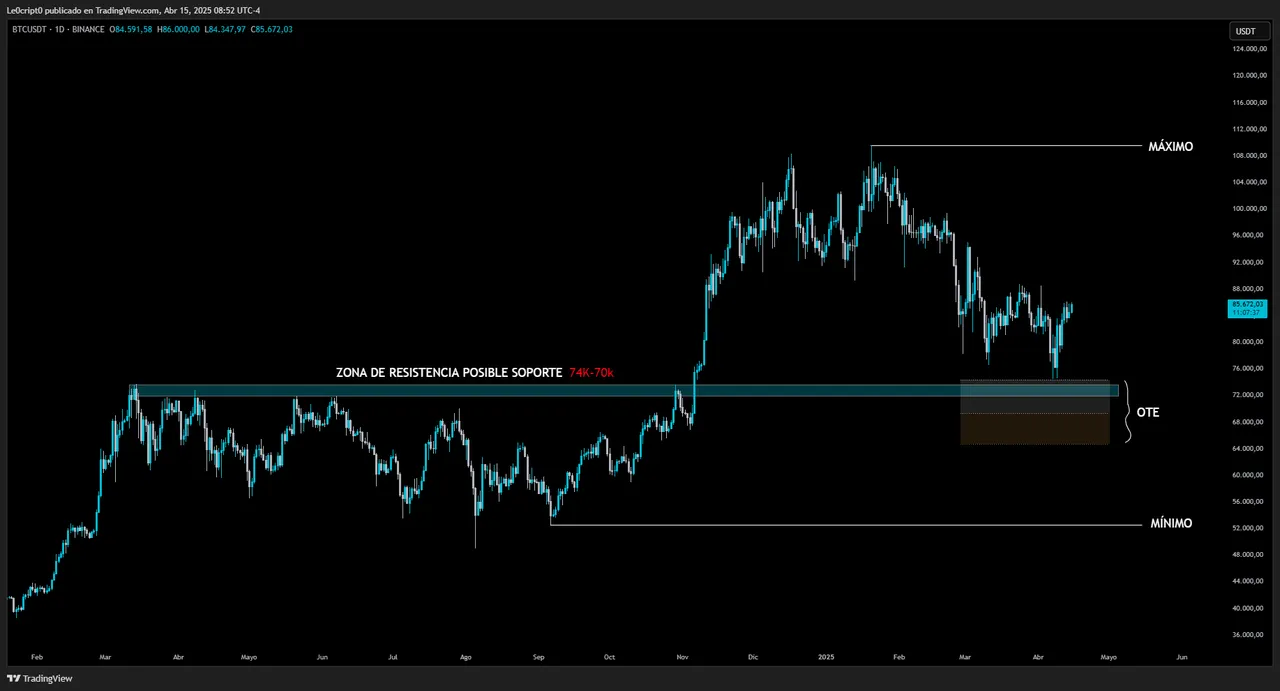
En GRÁFICO DIARIO la tendencia principal sigue siendo alcista y nos encontramos en un retroceso de dicha tendencia.
La zona de posible reversión está entre los 74k a los 70k donde confluyen los máximos de ciclo anterior que pueden funcionar como soporte y ademas la zona OTE(Optimal Trade Entry) de Fibonacci. Bitcoin lleva una caída de un 32% aproximadamente desde su ATH en los $109000
GRÁFICO DE 4 HORAS
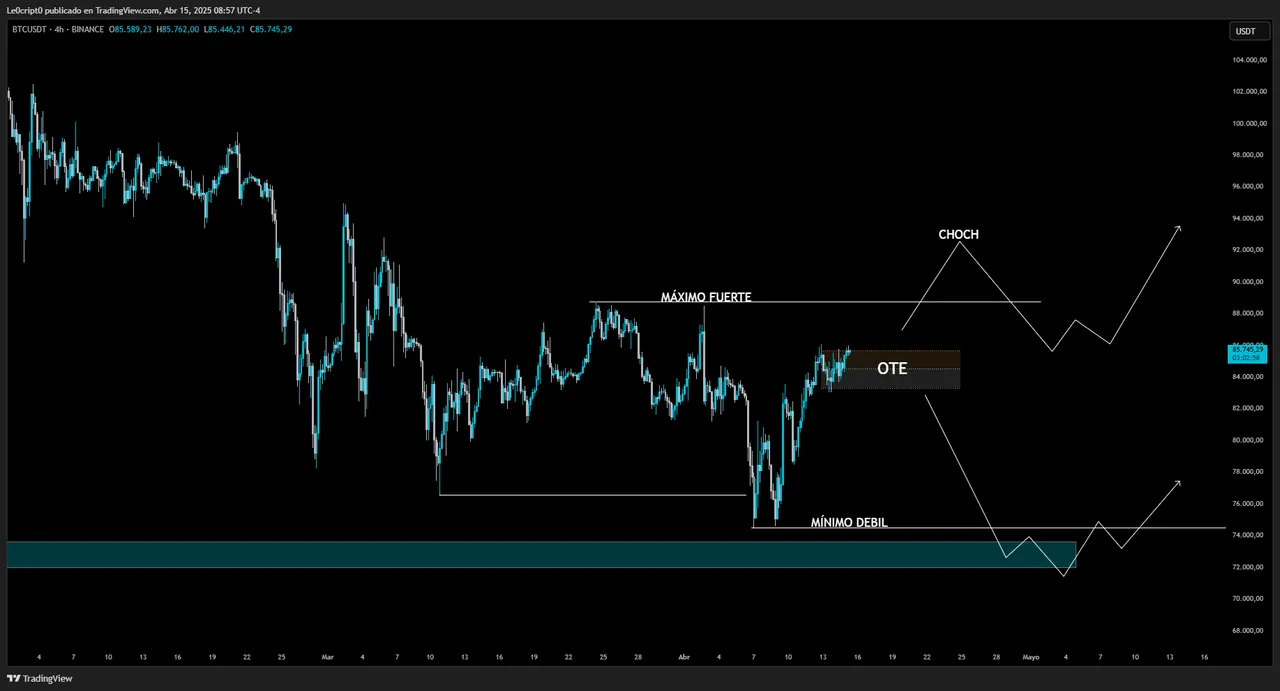
En H4 la tendencia sigue siendo bajista con una estructura bastante clara de máximos y mínimos descendentes.
En el momento de escribir este post nos encontramos en la Zona OTE de un retroceso de dicha tendencia y por tanto estamos en zona para buscar posibles entradas en short si se dan las debidas confirmaciones.
GRÁFICO DE 1 HORA/15 MINUTOS
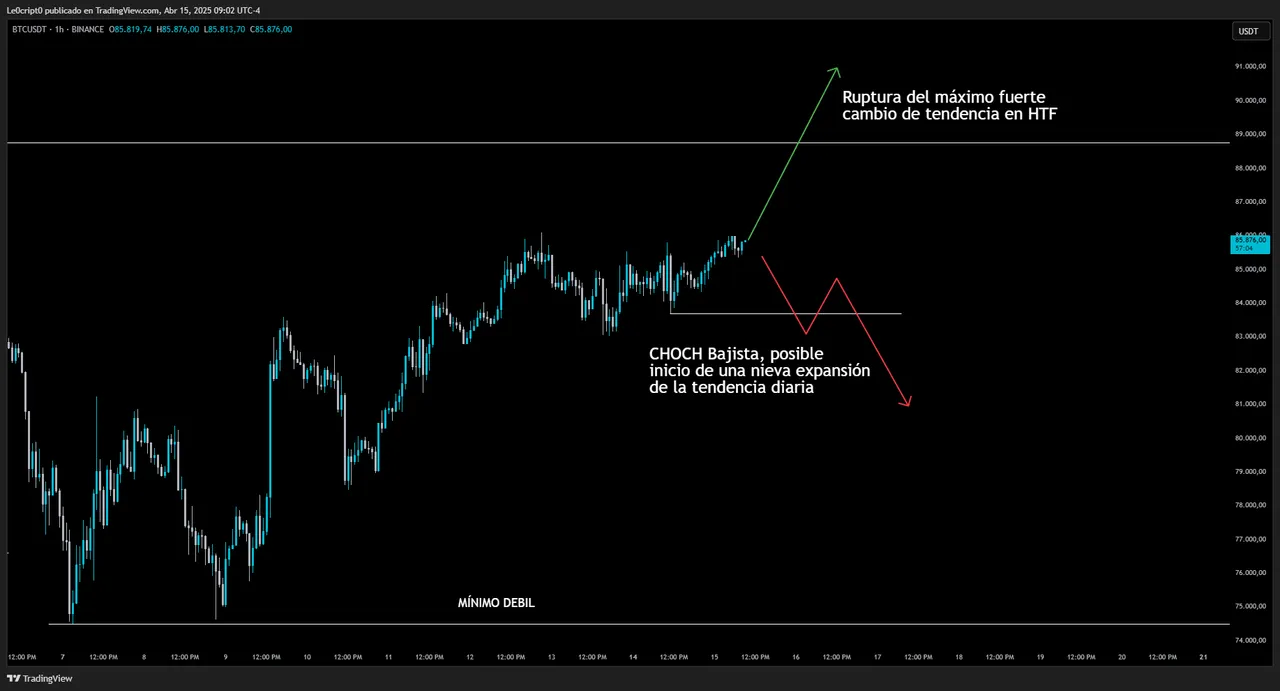
En gráfico de 1 hora estamos en la zona decisiva. Si la fuerza alcista continúa tendremos un cambio de la tendencia en alta temporalidad pero mantenemos la idea de que la zona actual es para buscar shorts, lo ideal sería esperar un CHOCH o cambio de caracter bajista u otro tipo de confirmación para operar a favor de dicha tendencia.
Recuerda que aunque tu deseo pueda ser que el precio suba no debes operar e ir a buscar en el gráfico lo que deseas sino interpretar de forma objetiva lo que vez y actuar en consecuencia.
Reflexión Final
Gracias por llegar hasta aquí. Recuerda que este análisis es parte de mi propio proceso de aprendizaje y crecimiento como trader, y lo comparto contigo con la intención de aportar valor. Si algo de esto te sirve para mejorar tu perspectiva o tomar mejores decisiones, entonces ha valido la pena.
Nos vemos la próxima semana con otro análisis.
¡Mucho éxito y buen trading!
ENGLISH

In this weekly post I share my interpretation of the cryptocurrency market, mainly Bitcoin. You'll find a detailed analysis of my perspectives, planning, and ideas for potential trades.
- Technical Analysis of DAILY, 4-HOUR, 1-HOUR or 15-MINUTE charts
- Key Zones of Interest
- Potential Trade Setups
- Thoughts and ideas about what I expect for my trading in the coming weeks
- My Action Plan
⚠️ IMPORTANT: This is not an attempt to predict or anticipate price movements, but rather an objective plan to react to the possible scenarios that may unfold during my trading week. I’m sharing it with the hope that it will be useful to you.
Remember that trading is a risky activity where you can lose your money, so be very cautious with the decisions you make.
DAILY CHART
On the DAILY CHART, the main trend is still bullish and we are currently in a retracement of that trend.
The potential reversal zone lies between 74k and 70k, where the highs from the previous cycle may act as support, and also where the Fibonacci OTE (Optimal Trade Entry) zone is located.
Bitcoin has dropped around 32% from its ATH at $109,000.
4-HOUR CHART
On the 4H chart, the trend is still bearish with a clear structure of lower highs and lower lows.
At the time of writing this post, we are in the OTE zone of the current retracement, making this a potential area to look for short entries—if proper confirmations appear.
1-HOUR / 15-MINUTE CHART
On the 1-hour chart, we are in a decisive area. If bullish strength continues, we could see a trend reversal on higher timeframes. However, I still maintain the idea that the current area is one to look for shorts. Ideally, I’d wait for a CHOCH (Change of Character) or some other bearish confirmation before trading with the trend.
Remember: just because you want the price to go up doesn’t mean you should trade in that direction. Don’t look for what you wish to see in the chart—analyze objectively and act accordingly.
🧠 Final Thoughts
Thanks for reading this far. Remember that this analysis is part of my own learning and growth process as a trader, and I share it with you with the intention of bringing value. If any of this helps you improve your perspective or make better decisions, then it was worth it.
See you next week with another breakdown.
Wishing you success and great trading!
Nota: Este post fue escrito originalmente en español y traducido al inglés con la ayuda de ChatGPT.
Todas las imágenes utilizadas fueron creadas en Canva y son capturas de pantalla tomadas desde TradingView.
Note: This post was originally written in Spanish and translated into English using ChatGPT.
All images used were created in Canva and are screenshots taken from TradingView.