Hello everyone, my name is Victor James, i am new to the platform. Before I introduce myself, I would like to use this opportunity to share my thoughts on the bullish candlestick pattern, also referred to as the uptrend movement.
https://images.app.goo.gl/J7KDGu2xumMB4fXo8[source]
In accordance with the law of supply, the lower wick shows that there was an excess of sells at the open, pushing the price lower to a point where there were a lot of buy orders.The sellers have all of their orders filled at this price point with a higher volume of buy orders, and the excess buyer orders drive up the price in line with the law of demand.
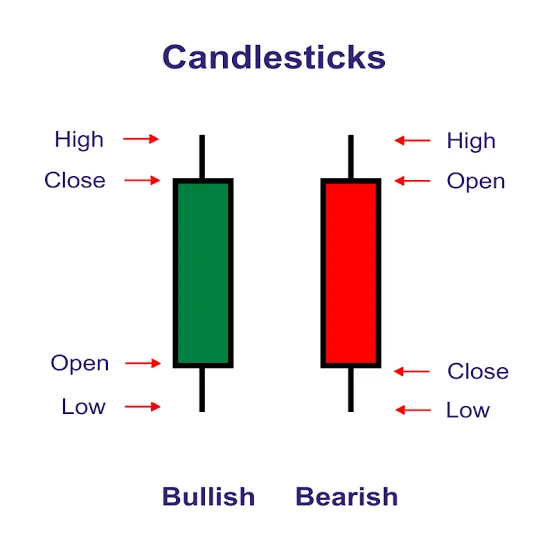
[1] Highs; this is the stock's highest price attained during that time frame.
[2] Close; this is the stock's final trading price during a given time frame.
[3] Open; this is the stock's initial trading price during a given time frame.
[4] Low; this is the stock's lowest price during the given time frame.
The zone of a bullish momentum candle stick is situated between the open and the low.
The bullish candle is where I place my emphasis.