Integrating Prometheus with Grafana
Once the collection of metrics has been configured with Prometheus, it would be very useful to integrate those metrics collected with Grafana, to have a more intuitive visualization of the data, thanks to its beautiful “dashboards”.
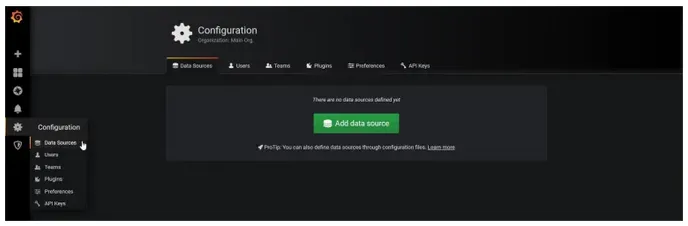
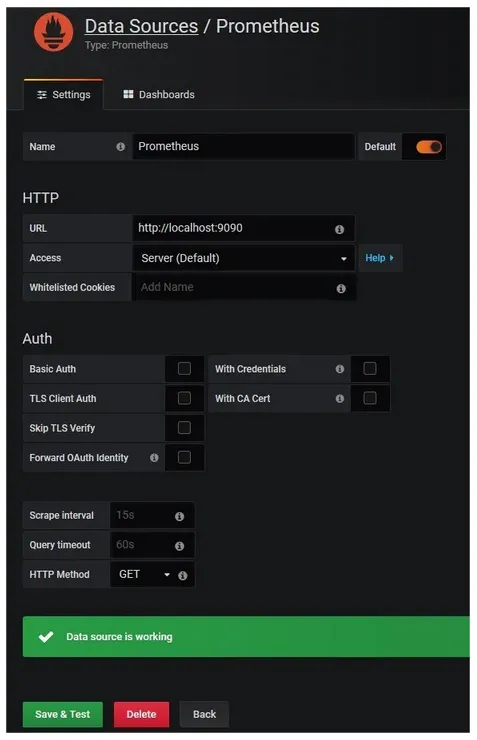
We add the source of the data, which in this case will be Prometheus, which in turn obtains the metrics from the Node Exporter on each linux host (including itself):
Configuration> Datasources> Add data source
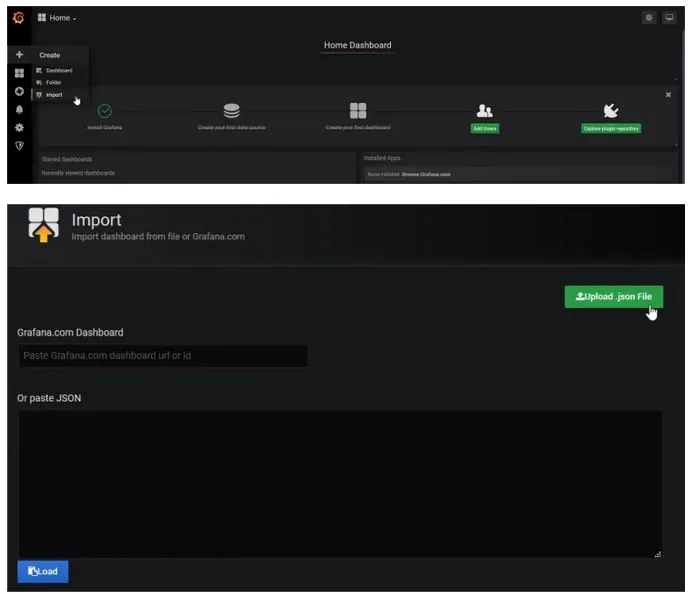
Now we could create our own “dashboards” to visualize the data or import any that have already been created by the community. For more info, reach the following link:
https://grafana.com/dashboards
An example could be:
https://grafana.com/dashboards/10283
This template has been imported and used in this example to view all collected metrics, using Prometheus Node Exporter:
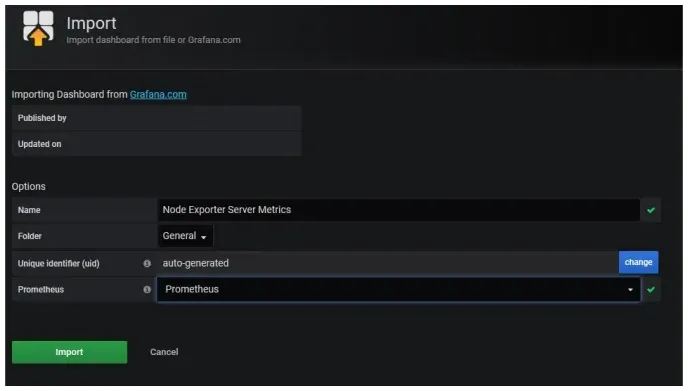
Images of the imported dashboard:
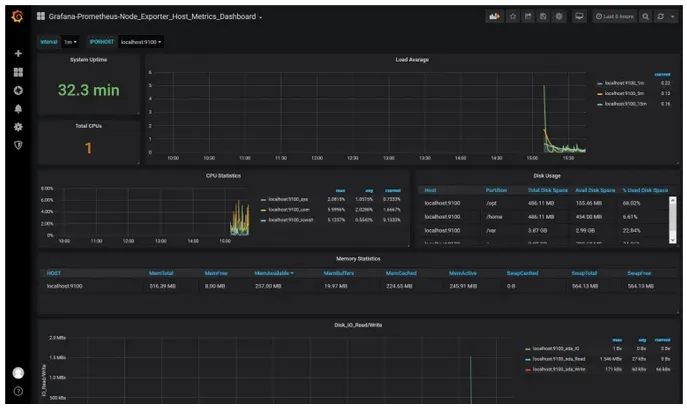
So far you have a monitoring system integrated with Prometheus and Grafana to view the historical metrics obtained by Node Exporter.