
How about friends, in the following lines I will talk about a very important topic about system monitoring.
Since taking the information that the system that we use gives us, we can detect multiple situations: From a failure in a server, problems in a service in production, a high demand for resources due to a memory overflow, among many other cases. Without data from our systems we are blind and could not foresee some situations.
This does not necessarily allow detecting a problem; We can also analyze the statistics and detect high demand for an application at certain times, allowing us to find bottlenecks, latency at strategic points.
Not monitoring our systems can trigger various problems that in the end can translate into monetary losses, users, bad image of the brand due to recurring problems. That is why the ability to respond to an incident makes a huge difference.
What is Prometheus?
Prometheus is a code alert tools and monitoring system. Its main characteristics are:
- A multidimensional data model with time series of data identified by metric names and by value / key pairs.
- Use PromQL, a flexible survey language to influence this dimensionality.
- Does not depend on a distributed storage; the surveyed servers are autonomous.
- The data collection time series happens via "pull model" over HTTP.
- Targets or "cards" are discovered by a discovery service or by static configuration.
- Supports multiple graphing and dashboarding modes.
Characteristics
After talking about the beginnings. Let's move on to the technical details, why it is so important and what makes it stand out from other similar tools.
We will talk about the main features, architecture and finally the basic steps to install and configure.
The main features of Prometheus are as follows:
A multidimensional data model with time series data identified by metric name and key / value pairs also known as labels:
structure:
metric name>{label name>=label value>, …}
example:
probe_success {instance = »192.168.1.15 ″, job =» server-01 ″}
PromQL, a flexible query language to take advantage of this dimensionality. Taking the previous point, we could do advanced queries in the following ways:
In this case, a regular expression is used that looks for an “environment” in the list to match and that the HTTP method is different from GET:
http_requests_total {environment = ~ »staging | testing | development», method! = »GET»}
In this other case we use time ranges. Looking for a job called "prometheus" and return us the last 5 minutes of this time series:
http_requests_total {job = »prometheus»} [5m]
Charts and dashboards support: prometheus directly has an interface to perform some actions. It is also compatible with third-party applications such as Grafana.
Components (edit)
Prometheus consists of multiple components, some are optional:
- The main Prometheus server that extracts and stores time series data.
- Libraries. In order to expose metrics of an application. Currently there are only 4 officially supported languages (go, java, python and ruby), but there are other libraries made by the community.
- A library that helps us for ephemeral processes or batch processes: Push gateway. The operation is simple, each time one of these processes is executed, it sends its metrics to the push gateway, it stores them and they are ready for prometheus to consult them, until the batch process runs again and sends new data.
- Exporters and integrations: There are exporters that are libraries that help extract information from servers, databases, storage, among other services and are exposed to only consume and store them. In addition to integrations to expose the metrics such as Grafana software.
- An alert manager. AlertManager. As its name says, it is in charge of managing the alerts that are sent to it, notifying through different channels or silencing alerts if a condition is met.
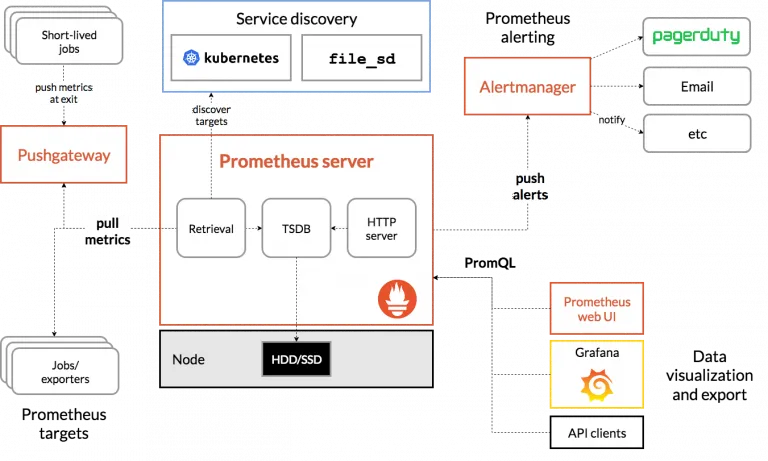
Architecture
After the explanation of the parts in which Prometheus is divided, in the following image you can see parts of the mentioned components and how the general flow is:
Installation:
Now we move on to the practical part, how to install and configure our monitoring server.
As an important piece of information, the installation will focus entirely on linux, but prometheus and the official libraries are supported on various operating systems: windows, bsd, among others.
We have several ways of installation:
- Directly from the Ubuntu or Debian repositories in their latest versions. One point against is that the official site does not mention which distributions are supported.
- Compiling from source code.
- Docker images.
In our case we will focus on the last option, because it is easy to deploy and update. In addition to handling it in a container, it adds several security measures for the type of implementation.
If you don't have docker installed, follow the steps in the official documentation
The installation is not complex and having the base docker installation we can move forward.
For people who do not know what docker is. In summary, it is a type of virtualization with containers, what it does is that this type of virtualization uses fewer resources than a full virtual machine and since the container shares libraries with its host it is much lighter, with benefits of faster operation. deployment of new containers.
Setting
The configuration files that we will use in prometheus are yaml files.
Before creating our docker container, we will create a file called prometheus.yml with the information that appears below or download it from the following link:
Global settings
global:
scrape_interval: 15s # The time interval in which the metrics are extracted. Default 1 minute.
evaluation_interval: 15s # The time interval in which the metrics will be evaluated for matches, only if you have rules configured.
Alertmanager - configuration of the targets where alerts are sent #when a rule matches
(At this time we do not have any target configured)
alerting:
alertmanagers:
- static_configs:
- targets:
- alertmanager: 9093
- targets:
Rules in yaml format, if they are met, alerts are launched
Rules that are related to global: ‘evaluation_interval’.
rule_files:
- "first_rules.yml"
List of endpoints from which metrics will be extracted
scrape_configs:
The job_name field is a label that will be added to all time series
that are extracted from this work
Example: job = <job_name>
- job_name: ‘prometheus’
static_configs:- targets: [‘localhost: 9090’]
Having our file created now if we create our container by executing the following command in the terminal:
docker run –name prometheus -d -p 9090: 9090 -v /home/eandrade/prom/prometheus.yml:/etc/prometheus/prometheus.yml –restart unless-stopped prom / prometheus
Explanation of the commands:
docker run: Create a new container
–Name: a custom name for the container, useful when you have multiple containers
-d: When running a container by default you enter the container and see the entire flow, but in this way it ends its creation and you can continue working.
-p: This way you can expose a port or range of ports and they are mapped with the host ports, otherwise you can only have access with the network created by docker.
-v: Volumes can be mounted in the container, they can be folders or files so as not to enter the container and edit them or have to copy them inside.
–Restart: It is a way of generating policies so that the container is restarted automatically, for example if you want that only in case of failure, that it always restarts unless the docker daemon is shut down or restarted or always the container is restarted.
prom / prometheus: Finally, this is the name of the image, if you did not download in advance the image is downloaded and later the container is created.
The result in the end is the generation of a unique identifier for the container, which must be taken care when sharing because with this identifier the created container can be manipulated:

In order to check that our container is running, we execute the following command:
docker ps

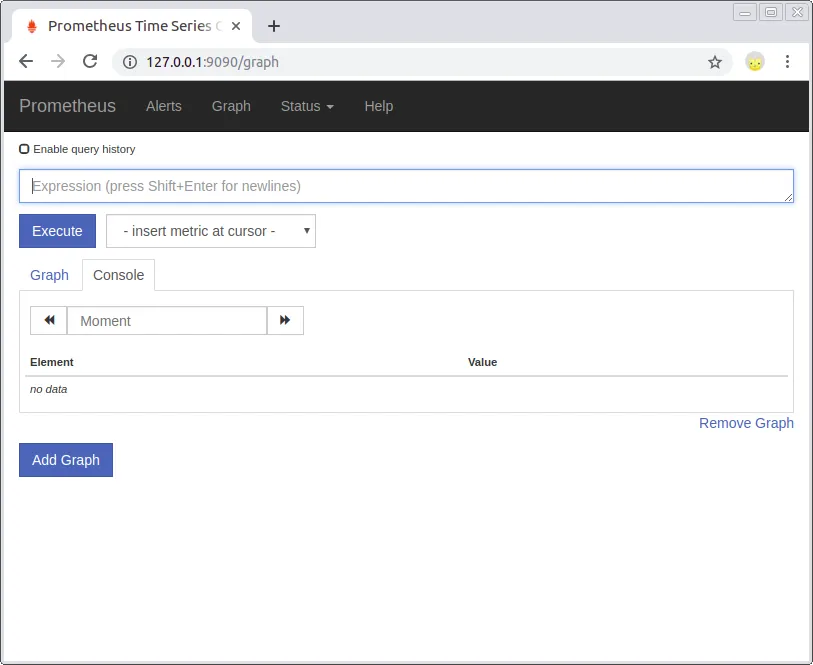
We can also access port 9090 by web, the default port for prometheus: http://127.0.0.1:9090
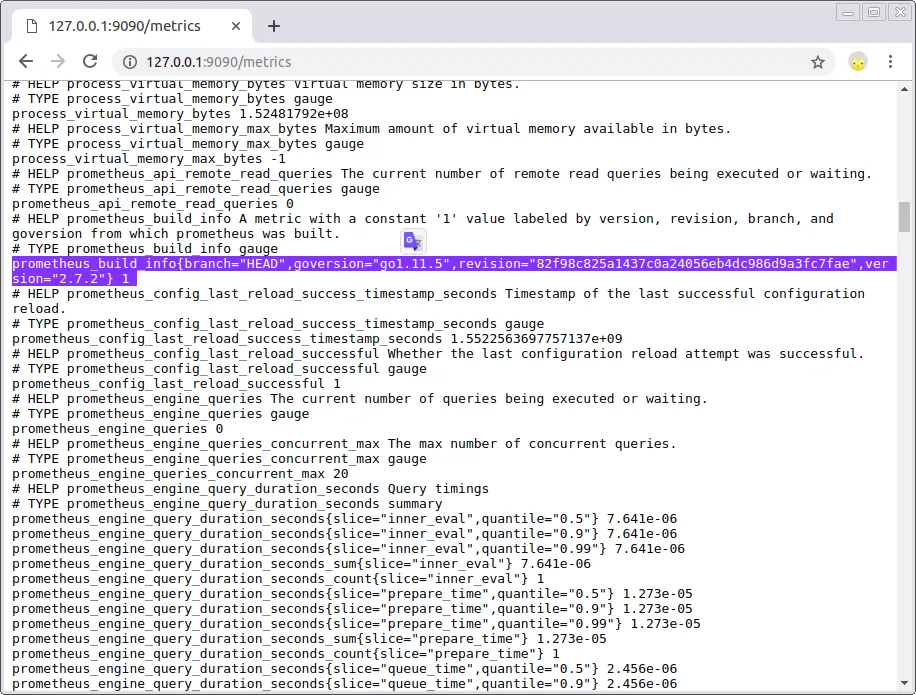
If you remember we created a base file in yaml and added a "job" that pointed to localhost. From the beginning prometheus is already exposing metrics by itself that we can see in / metrics and can be displayed from a third-party application.
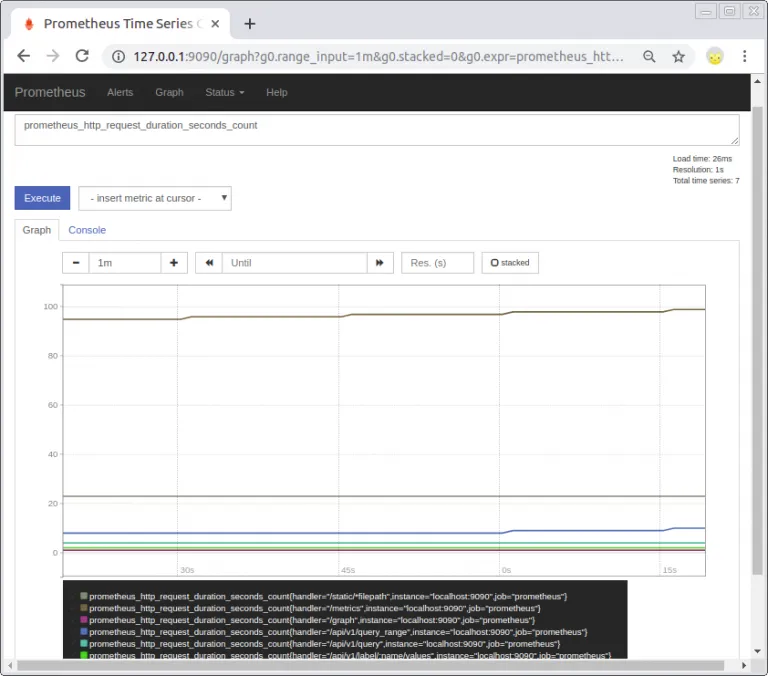
As prometheus is already working, we can make a query and view a graph of the metrics that it is generating by itself.
From this point, according to their needs, they can use a client and / or an exporter to start generating data and be able to launch alerts. Here is a list of some that are widely used and are project officials:
 Node exporter: An exporter for hardware, generating metrics for resources, system processes, storage, and for example systemd processes (disabled by default)
 Blackbox exporter: Endpoint testing using HTTP, HTTPS, DNS, TCP and ICMP.
 AlertManager: The official alert manager, allows notifications by email, to multiple services of different brands and webhook if you need something different.
 Push gateway: In case of having processes that run every so often as a cron script.
You can see the complete list here: https://prometheus.io/docs/instrumenting/exporters/
Conclusions
Prometheus over time has become a very important tool in its segment. Mainly due to the fact that in recent years we have seen serverless architectures grow generating many services to monitor, it was the case of SoundCloud at the time.
In this article it was tried, beyond comparing the various existing applications, to show the benefits of this project in a general way and in case of meeting their needs to be able to implement it in their organizations.
In later posts I will write in detail about how to be able to work with exporters, be able to configure rules and launch alerts.