
Grafana is a free software based on the Apache 2.0.2 license that allows the display and formatting of metric data. Create dashboards and charts from multiple sources, including time series databases. Among its main features are:
Grafana is cross-platform without any dependencies and can also be deployed with Docker. It is written in the Go language and has a complete HTTP API.Grafana prevents users from accidentally overwriting a control panel. Similar protection exists when creating a new dashboard whose name already exists.The tool offers the ability to configure alerts.
Implementation and configuration of Grafana:
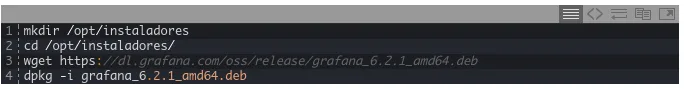
Installing grafana using ".deb" package:
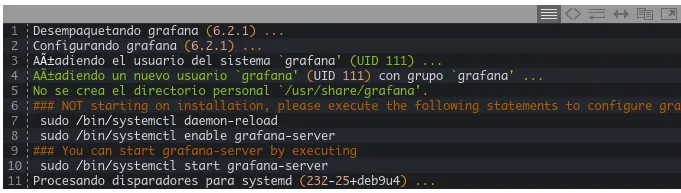
It should return something like this:
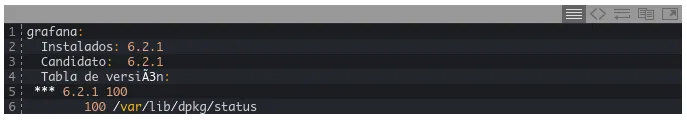
We verify the installed version:

It should return something like this:
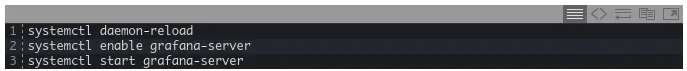
Starting Grafana
Reload systemd, start and enable grafana to run at system startup:
We access the Grafana WebGUI:
http: // server_ip: 3000
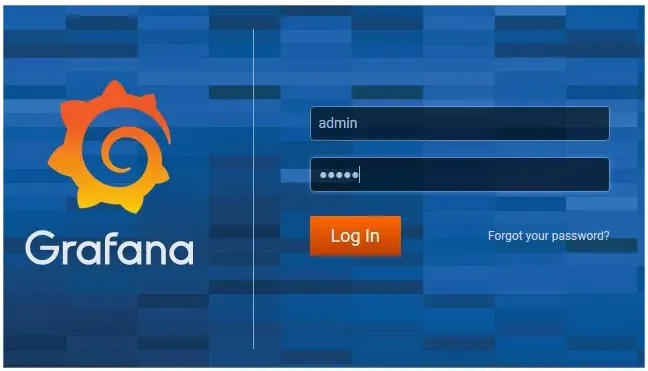
user: admin
passwd: admin
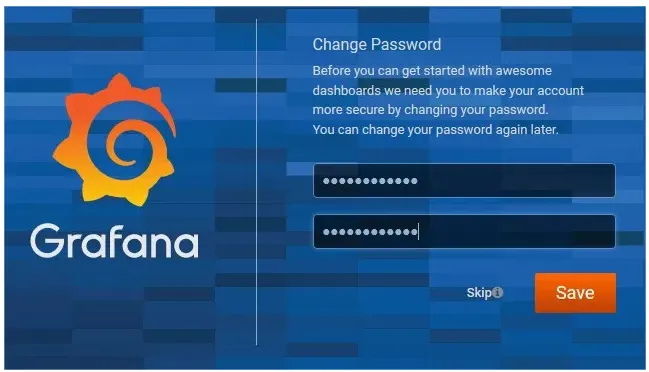
We define a new password for the management of the site and we continue:
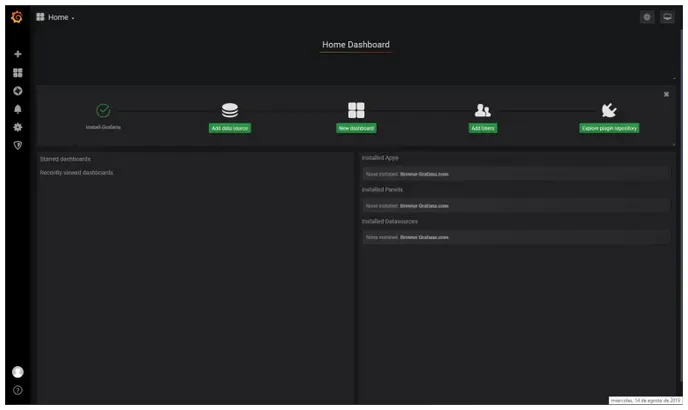
With this done, we already have Grafana installed in our system.