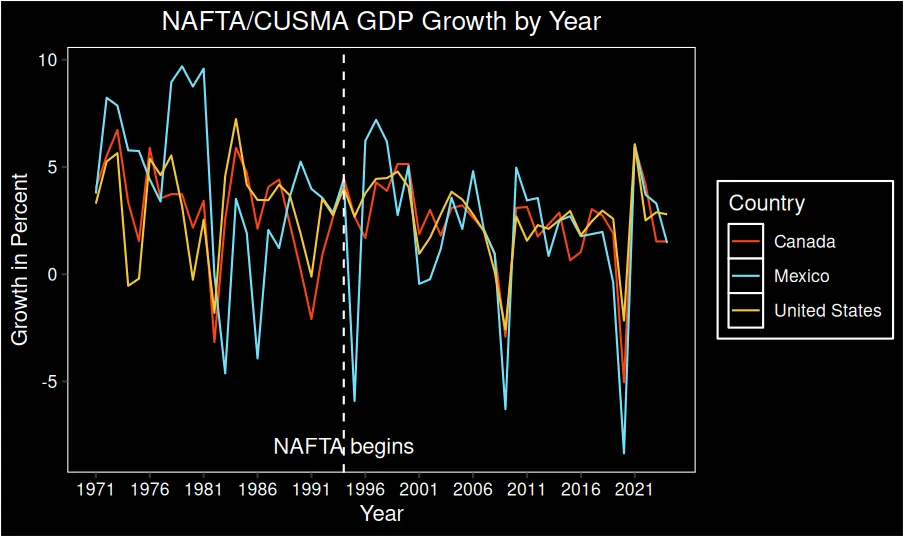
I used the R programming language to make this graph, which illustrates how the GDP growth rates of the United States, Canada, and Mexico have become much more intertwined since the implementation of NAFTA in 1994. What I find most interesting about this graph is that the United States and Canada always moved closely together, but prior to the passage of NAFTA, Mexico was the real outlier. Notice that around 1980, Mexico had a huge spike in GDP growth, but the U.S. and Canada both had a pretty major decline. Again, in 1991, the U.S. and Canada had a decline, whereas Mexico had a spike. After the implementation of NAFTA in 1994, the economies tended to move much more closely together.
Note: Data from World Bank (2025)
Moreover, it appears that the longer NAFTA has been in effect, the closer the relationship between these economies has become. Notice that in the late 90s, Mexico, Canada, and the United States all had increases in GDP, but Mexico's increase was much more than Canada's and the United States'. Mexico also hit peak GDP growth a bit earlier than Canada and the U.S. hit their relative peaks. However, by the time of the 2008 and 2019 downturns, all three countries hit their peaks and troughs at about the same time.
Obviously, there are many different variables that influence a country's GDP growth rate, and this single graph shouldn't be taken to imply that NAFTA was good for any specific country or that it was bad for any specific country. At least from my perspective, the main takeaway is that trade integration can also lead to economic integration. It also appears that the longer a trade agreement is in effect, the more interlinked the economies become.
Note: That NAFTA was changed to CUSMA in 2020 but that the purpose is similar to the original NAFTA (Lobosco et al., 2019). For the purposes of this analysis, NAFTA and CUSMA are treated as a single continuous trade agreement.
References
Lobosco, K., Fung, B., & Luhby, T. (2019, December 10). USMCA and NAFTA: What’s the difference between the US Mexico Canada trade deals? CNN. https://edition.cnn.com/2019/12/10/politics/nafta-us-mexico-canada-trade-deal-differences
World Bank. (2025). GDP growth (annual %). https://data.worldbank.org/indicator/NY.GDP.MKTP.KD.ZG