Shorter Version
Date: June 5, 2025
Prepared For: Professional Financial Analyst & Short-Term Trader
Prepared By: Crypto Lover Artist and Amanda's Financial Markets Analysis Desk

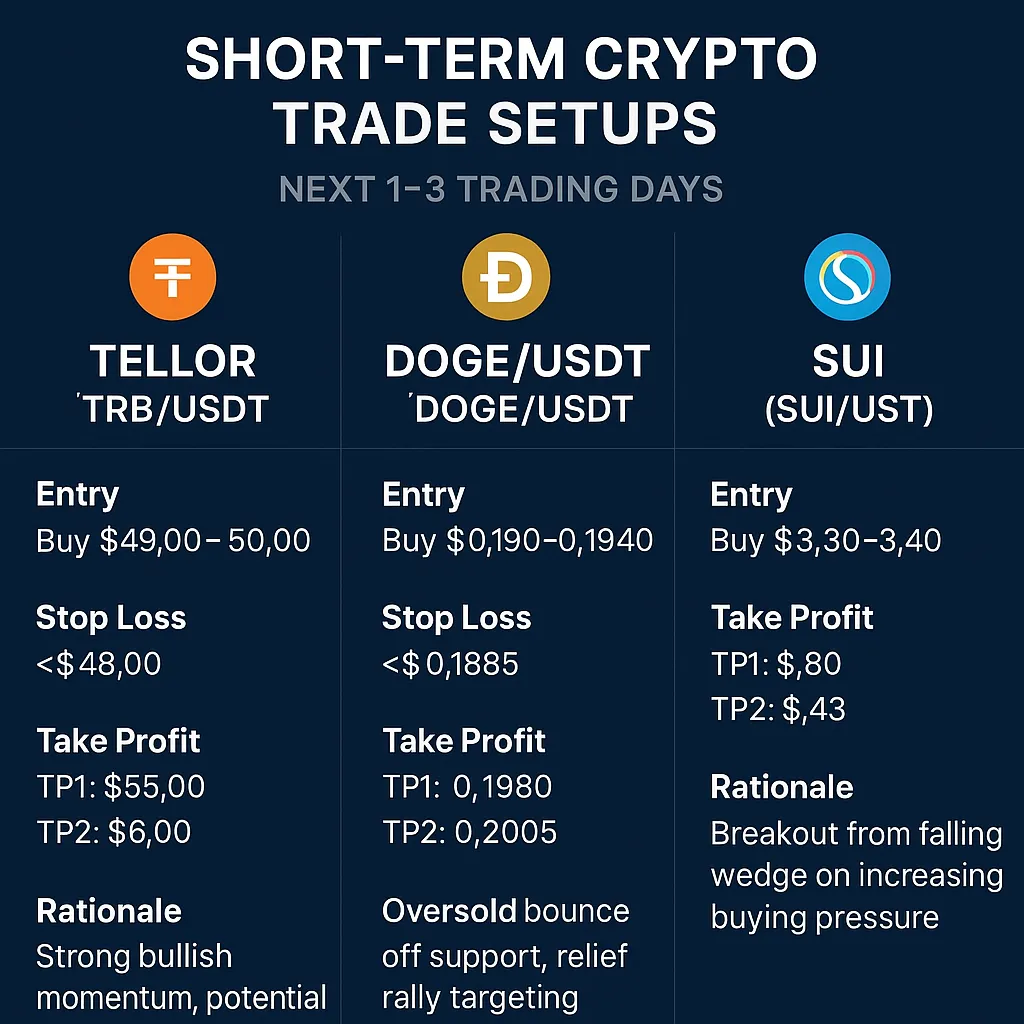
Trade Idea 1: TRB/USDT – Long (Tellor)
- Asset & Exchanges: Tellor (TRB); available on Binance & Gate.io (spot markets).
- Entry (Buy): Aggressive: Buy dip around $49.00–$50.00 support zone. Conservative: Buy breakout above $52.32 (recent high) with strong volume confirmation. Current price ~$50.7 after a +20% rally.
- Stop Loss: <$48.00 (below key support at $48 to limit downside).
- Take Profit Targets: TP1: ~$55.00 (first resistance/psychological level). TP2: ~$60.00–$60.70 (next major swing high area).
- Risk-Reward Ratio: Approximately 1:2 to TP1, up to 1:4 at TP2 (e.g. risking ~$2 to potentially gain ~$4–$8).
- Rationale: TRB has shown strong bullish momentum, trading above its 7, 25, and 99-day EMAs (signifying an uptrend). Momentum indicators are positive – RSI is ~64 (bullish but not overbought) and MACD is printing a bullish histogram. This suggests room for further upside. However, volume has been below average (current volume ~39% under its 5-day average), so a slight pullback toward $50 could occur before continuation. We aim to buy near support ($49–$50) to improve risk/reward, then ride any momentum push toward the next resistances at ~$55 and ~$60. A stop below $48 protects against a failed breakout (low-volume rejection could send TRB back toward $48 or lower). Overall sentiment on TRB is positive (it led gains in its sector), but we need a volume uptick to confidently break $52.3 and rally higher.
Trade Idea 2: DOGE/USDT – Long (Dogecoin)
- Asset & Exchanges: Dogecoin (DOGE); available on Binance & Gate.io (spot markets).
- Entry (Buy): $0.1900–$0.1940 zone, which is a recent support and oversold bounce area. Wait for an uptick in momentum (e.g. RSI climbing back above 30 or a bullish reversal candle) as a trigger, or a break above ~$0.196 with volume to confirm the bounce.
- Stop Loss: <$0.1885 (just under $0.189 support low). This is ~3% below entry, to cut risk if Doge makes new lows.
- Take Profit Targets: TP1: ~$0.1980 (minor resistance from intraday high). TP2: ~$0.2005 – $0.2015 (major resistance near the 7-day EMA and recent peak). Scale out here, as $0.200–$0.209 is a known supply zone.
- Risk-Reward Ratio: Approximately 1:2 (risking ~3% to target ~6%+ on full move).
- Rationale: DOGE plunged into oversold territory – RSI 24 (well below 30) indicating a potential bounce setup. Price is sitting near its recent range support ($0. nineteenth) after a sharp drop. Historically, Dogecoin tends to rebound from oversold RSI levels (RSI <25 has led to bounces with high probability). The plan is to capitalize on a relief rally: buy near $0.19 support and sell into the ~$0.20 resistance area. The 0.2000–0.2015 zone aligns with the 7-day EMA and prior highs, likely capping a short-term bounce. We keep a tight stop under $0.188 to avoid a deeper decline (a break below $0.188 could signal continuation toward $0.18). Market sentiment for memecoins is cautious right now, but any positive catalyst (e.g. an Elon Musk tweet or a sector rotation) could quickly spur a Doge rally. This setup aims to scalp a quick upside in a choppy market, with confirmation from volume needed for confidence.
Trade Idea 3: SUI/USDT – Long (Sui)
- Asset & Exchanges: Sui Network token (SUI); available on Binance & Gate.io (spot markets).
- Entry (Buy): $3.30–$3.40 region. SUI is consolidating after a pullback – this range is near recent lows and the breakout retest area. Optionally, add on a confirmed push above ~$3.80 (recent local high) to signal bullish continuation.
- Stop Loss: <$3.10 (just below $3.11 support – a breakdown here would invalidate the wedge breakout).
- Take Profit Targets: TP1: ~$3.80 – $4.00 (prior rebound high and round number resistance). TP2: ~$4.30 (projected move from the wedge pattern). Stretch goal if momentum continues into next week.
- Risk-Reward Ratio: Approximately 1:3 (e.g. ~6–7% downside vs ~15–20% upside to TP2).
- Rationale: SUI/USDT 4-hour chart – Price broke out of a falling wedge pattern (a bullish reversal signal), with a projected move toward ~$4.30. After a DEX hack-induced dip in May, SUI rebounded strongly. Technically, it broke out of a falling wedge formation on the 4H chart, indicating the downtrend may be reversing to an uptrend. The Chaikin Money Flow (buying pressure) turned positive as well, suggesting buyers are returning. There was a large token unlock on June 1, which created volatility, but historically SUI tends to rally after initial post-unlock selling if demand returns. With that precedent, we anticipate an upswing toward the $4+ area in the short term. Our first target ~$3.80 is near the last bounce high, and $4.30 comes from the wedge breakout’s implied reach. We use a stop under $3.10 because failure to hold that level could signal a deeper drop (the bearish scenario sees SUI sliding back toward ~$3.11 or lower). Overall market sentiment on SUI is improving due to its recent technical breakout and the cooling of selling pressure; as long as Bitcoin and large caps remain stable, SUI has room to run in the coming days.
Note: These trade setups are based on technical analysis and recent market data. Always ensure proper risk management (e.g. position sizing, use of stop losses) and be mindful of sudden news that can affect crypto prices. Medium risk tolerance means some volatility is expected – consider adjusting leverage or targets to your comfort. (This is not financial advice; rather, a short-term analysis of potential opportunities.)