Yes, that's the bad news.
The good news is: I still have all data and the collection of statistics of $LEO, $BEER, $POB, $CHARY and $SIM is ongoing
And another good news is: It happened now and not in a later state of my statistic project (fail early).
So, what has happend?
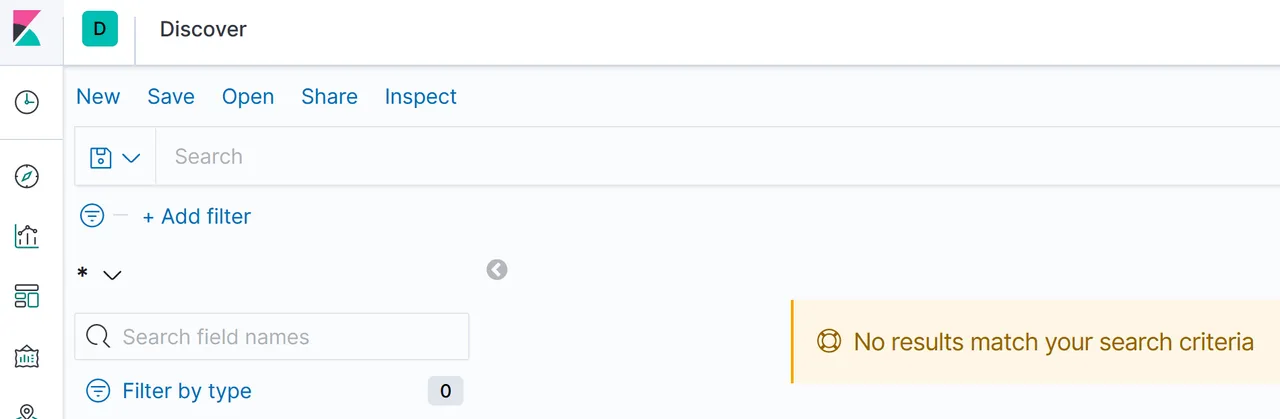
My Empty Elasticsearch Database
As you may know, I have a project, where I collect logs from several coins and put them into Elasticsearch. With Kibana, I visualize the data.
Elasticsearch is running on my Raspberry Pi in a docker environment.
On Wednesday I have installed some new software on my Pi. With this I did an upgrade for the operating system. And with this, I stopped the docker instance, for the first time.
Docker is a kind of virtual PC. And everything that is stored in this environment gets loss, when you stop the instance, so the Elasticsearch database. I wasn't aware of it. But it is a good apprentice's premium (Lehrgeld - something that you pay to learn it).
What does it mean?
It means, that I am not able to create statistics at the moment. The data is still there, because they are collected in logfiles. You can find them in github also. So that's not the problem. But I have to:
1.) Find a permantent solution, that the data from elasticsearch is stored outside of the docker image (i.e. mount a folder).
2.) Recreate all views in Kibana
3.) Pump all the data back to Elasticsearch
I am working on this stuff in my free time and I never can tell how much time I have for it, as it doesn't have the highest priority. And I am on holiday in the next days. So it maybe take weeks until I can offer this service again.
Sorry for that. But I want to repair it as soon as possible.
But there is also some good news
@detlev asked me, if I can also observe how often the BEER-Bot stakes $BEER to people. And the answer is yes!
Here are my first results
I collect the data with this command:
curl -X 'GET' 'https://accounts.hive-engine.com/accountHistory?account=beerlover&limit=10&offset=0&symbol=BEER' -H 'accept: application/xml'
The result looks like this:
[{"_id":"60d5ace7e635ce01aeac009e","blockNumber":8109773,"transactionId":"ff344b2430648b3740eb3f73718d1ecd23352006","timestamp":1624616160,"account":"beerlover","operation":"tokens_stake","symbol":"BEER","from":"beerlover","to":"beerlover","quantity":"0.100"},{"_id":"60d5aacbe635ce01aeabfe9f","blockNumber":8109597,"transactionId":"ec3e254d0e4a202e06c00f8aa426beb586348343","timestamp":1624615620,"account":"beerlover","operation":"tokens_stake","symbol":"BEER","from":"beerlover","to":"umuk","quantity":"0.100"},{"_id":"60d5aa92e635ce01aeabfe5d","blockNumber":8109578,"transactionId":"90177c3a08548bcf9b534854bf13220ce0867f48","timestamp":1624615563,"account":"beerlover","operation":"tokens_stake","symbol":"BEER","from":"beerlover","to":"umuk","quantity":"0.100"},{"_id":"60d5a9cee635ce01aeabfd33","blockNumber":8109513,"transactionId":"13860d575dc86701ca4a6973a032e23cf443896c","timestamp":1624615368,"account":"beerlover","operation":"tokens_stake","symbol":"BEER","from":"beerlover","to":"serialfiller","quantity":"0.100"},{"_id":"60d5a4bbe635ce01aeabf886","blockNumber":8109092,"transactionId":"94f7965fc6758d5bbd7bfa31fe1ff03327359e78","timestamp":1624614069,"account":"beerlover","operation":"tokens_stake","symbol":"BEER","from":"beerlover","to":"mad-runner","quantity":"0.100"},{"_id":"60d5a2ede635ce01aeabf6fa","blockNumber":8108939,"transactionId":"20fb5c2f81d89f4d616496e853fdd2eff3248548","timestamp":1624613607,"account":"beerlover","operation":"tokens_stake","symbol":"BEER","from":"beerlover","to":"dragosroua","quantity":"0.100"},
...
This can be put to Elasticsearch via
curl --location --request POST 'http://localhost:9200/beerbot/_bulk?' --header 'Content-Type: application/json' --data-binary @$LOGDATE
I will go on with this, as soon as I have repaired my database.
More Details
For more details see here: How I Have Set Up Elasticsearch And Kibana On My Raspberry Pi To Monitor Token Activities and here: Do You Want To See Statistics Of Your Favorite HIVE Token? or on github.
Regards, Achim Mertens