I tend to look at least at a 1 year horizon of the stock as I'm more of a position trader than a swing trader. While the daily charts help look for immediate entry opportunities, using a lower frequency horizon like Weekly is useful in determining trends.
Philippine Market
i.) Daily Chart
The daily chart shows some strength in the index as it tries to break out of the 200 SMA the 2nd time around. We need further validation by looking at a different horizon. Let's try the Weekly chart.

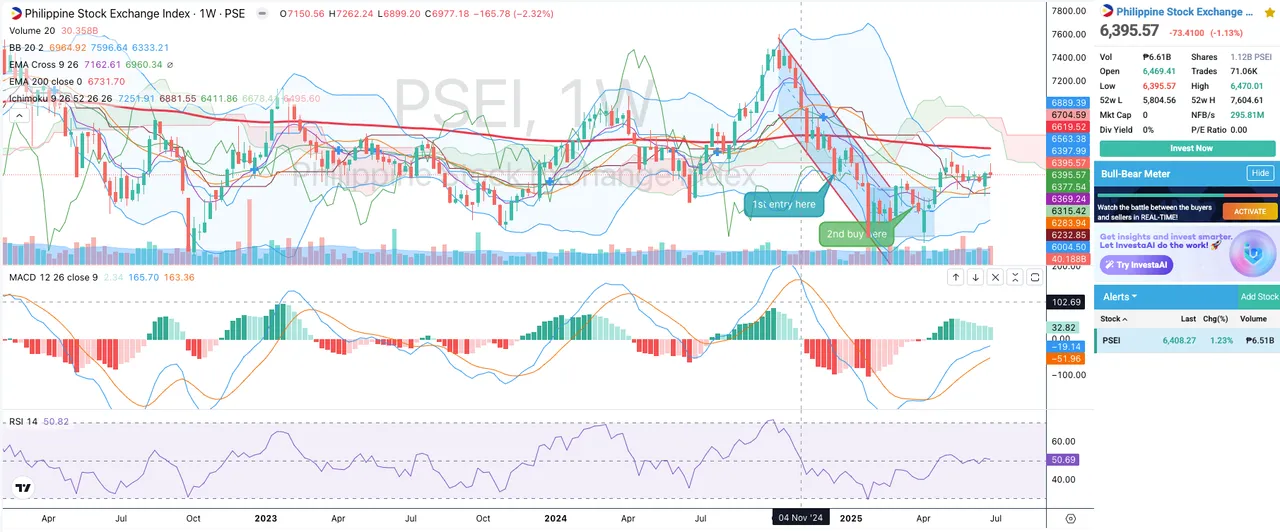
ii) Weekly Chart
We see 2 resistances here. First is the entry to the kumo and the other one is the 200EMA weekly line which is higher compare to the daily version. This may mean that it would take more weeks before we can really see some breakout assuming that the rise will be gradual.
Stocks in Study
Still in the process of rebalancing my portfolio to get rid of the laggards, so I need to review current positions whether I can sell or average down.
i.) CEB (Cebu Air Inc) -
Daily chart looks great and posing to increase further. Let's see what would be its peak.
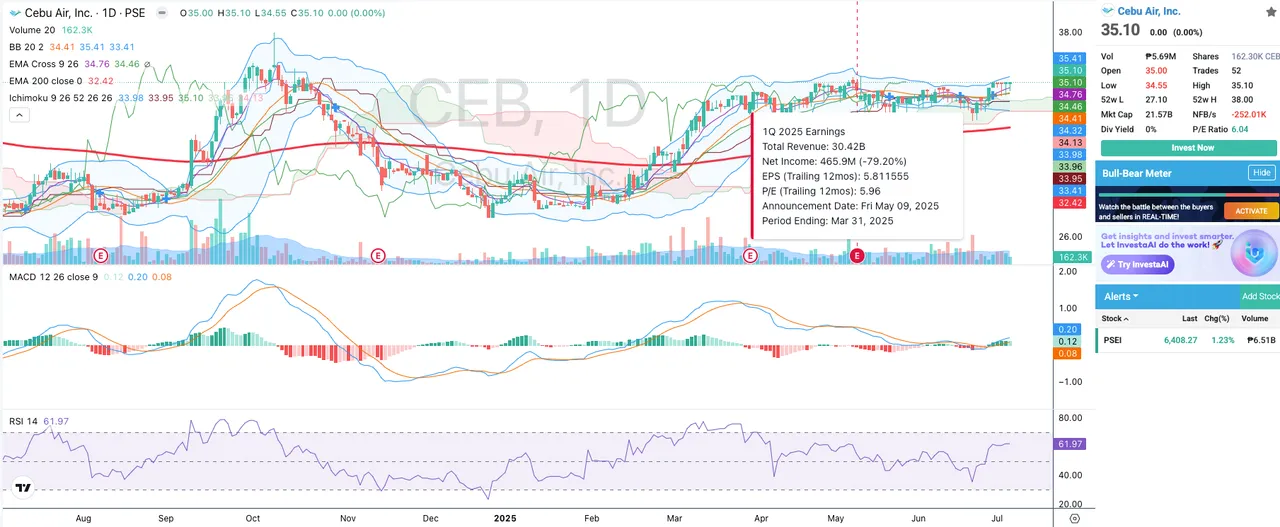
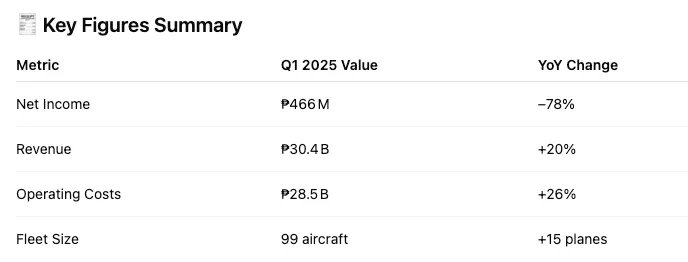
Q1 Earnings had a massive hit but mainly due to capital expenses for fleet expansion. Net income is expected to be lower compared to last year due to financing costs. Good to note that revenues are increasing meaning there is a healthy demand. Company just needs to manage its costs.
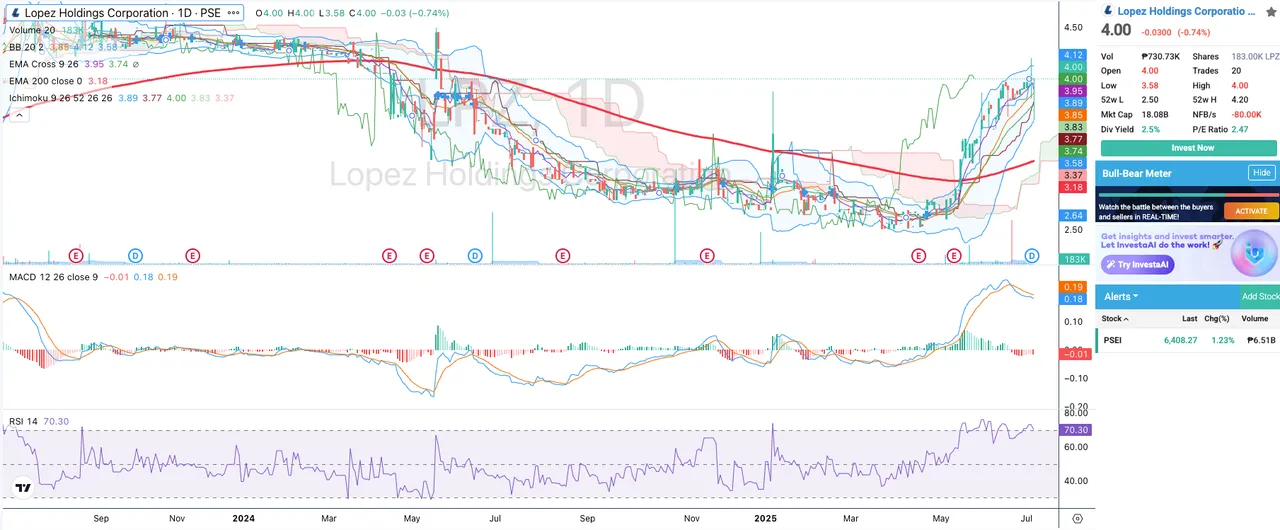
ii.) LPZ ( Lopez Holdings Corporation)
This 2 year chart shows that LPZ has been trading lower than the average since last year. Was only able to get back above 200EMA in May. It's such a steep climb, so the question is on its sustainability.
Reduced ABS-CBN's equity losses
Large impairment losses and operational losses due to disenfranchisement impacted LPZ's bottomline. Now that we are seeing improvements due to managing costs, the stock is seen as undervalued.
Back to the chart, we shall see if there would still be more room to increase the stock price or if it's nearing its peak that it's time to sell.
This is not financial advise. I use this as my trading journal/notes for ongoing reference for the succeeding week. The above technical analysis (charts) are just used for guidance while studying market behavior and trying my hand on market timing. Please Do Your Own Research (DYOR).
- Stock Charts from Investagrams