(DE) Support und Widerstand Linien, warum die Preis-Aktion stoppt oder wieder umkehrt.

Support und Widerstandslinien sind eine der am häufigsten verwendeten Techniken für technische Analysen. Tatsächlich können Sie mit ihnen wichtige Informationen abrufen. Informationen, die Sie theoretisch bereits in die Lage versetzen, erfolgreich zu handeln.
In diesem Post lernen Sie die wichtigsten Aspekte von Support und Widerstand kennen. Ich erkläre Ihnen, was es ist, warum es wichtig ist, wie es funktioniert, wie Sie es nutzen können und vieles mehr!
Was ist Support und Widerstand?
- Support: Der Support ist eine Zone, auf die der Preis gefallen ist, die aber aufgrund der größeren Nachfrage auf diesem Niveau nur schwer zu durchbrechen ist.
- Wiederstand: Der Widerstand ist eine Zone, bis zu der der Preis gestiegen ist, in der es aber schwierig ist, ihn zu durchbrechen, weil es auf diesem Niveau ein größeres Angebot gibt.
Der Grund von Support und Widerstand ist einfach Angebot und Nachfrage. Auf einem Unterstützungsniveau gibt es mehr Käufer (Nachfrage) als Verkäufer (Angebot) und auf einem Widerstandsniveau ist es genau andersherum.
Beispiel für Support: Wenn der Preis eine Währung sinkt und damit billiger wird, sehen die Käufer ein besseres Angebot und sind eher geneigt zu kaufen. Die Verkäufer sind dann weniger geneigt zu verkaufen, weil sie dann zu einem niedrigen Preis verkaufen müssen, was ein schlechtes Geschäft ist. In diesem Fall bildet sich also ein Unterstützungsniveau, weil die Käufer die Oberhand haben, wodurch der Preis nicht noch weiter fallen wird.
Beispiel für Widerstand: Wenn der Preis eine Währung steigt und damit teurer wird, sind die Verkäufer eher geneigt zu verkaufen, weil der Preis hoch ist. Die Käufer hingegen werden dann weniger geneigt sein, zu kaufen. In diesem Fall gibt es also ein zunehmendes Angebot (mehr Verkäufer) und eine abnehmende Nachfrage (weniger Käufer), was dafür sorgt, dass der Preis nicht weiter steigen kann (Widerstandsniveau) und theoretisch zu fallen beginnt.
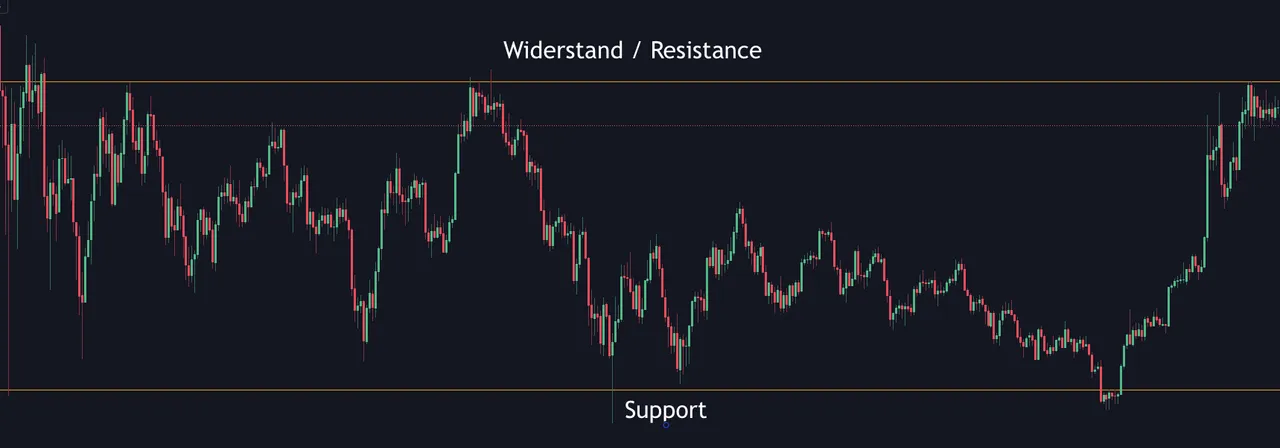
Horizontale Support- und Widerstandslinien
Die stärksten Support- und Widerstandszonen sind die horizontalen Linien. Diese Zonen entstehen durch eine hohe Kaufkraft auf horizontaler Niveau.
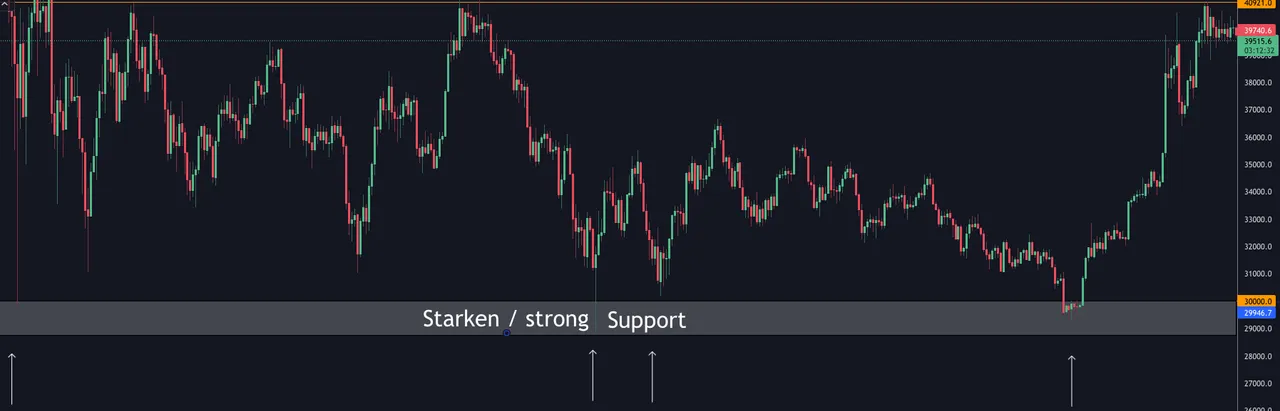
Oft sind runde Zahlen auch horizontale Support- und Widerstandszonen. Dies ist darauf zurückzuführen, dass die meisten Menschen mit runden Zahlen kaufen oder verkaufen. Nicht nur Trader, sondern auch Investoren.
So ist es zum Beispiel plausibler, dass die Leute auf der $30.000 Support-Zone kaufen, anstatt auf $31.270,50-, was dazu führt, dass es viele Käufer auf der $30.000 Support-Zone gibt. Dieses Niveau stellt somit eine starken Support dar. In der Abbildung unten können Sie sehen, dass die $30.000 Zone ein starken Support darstellt, da es viele Käufer gibt.
Diagonale Support- und Widerstandslinien
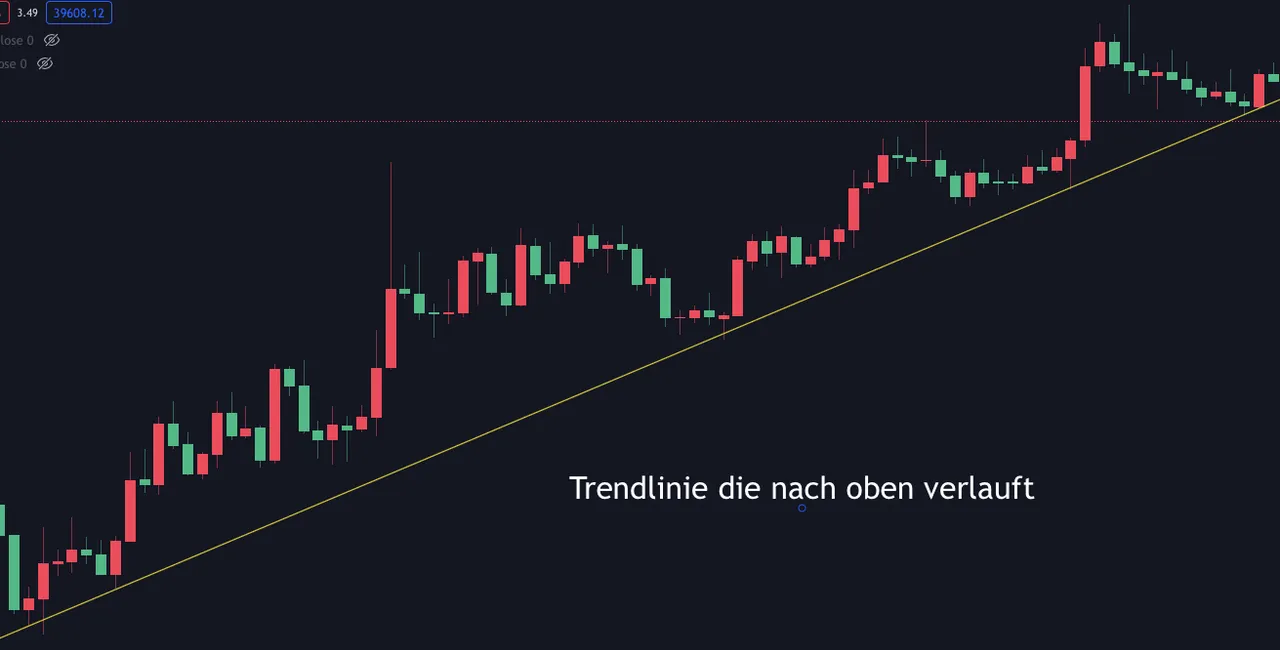
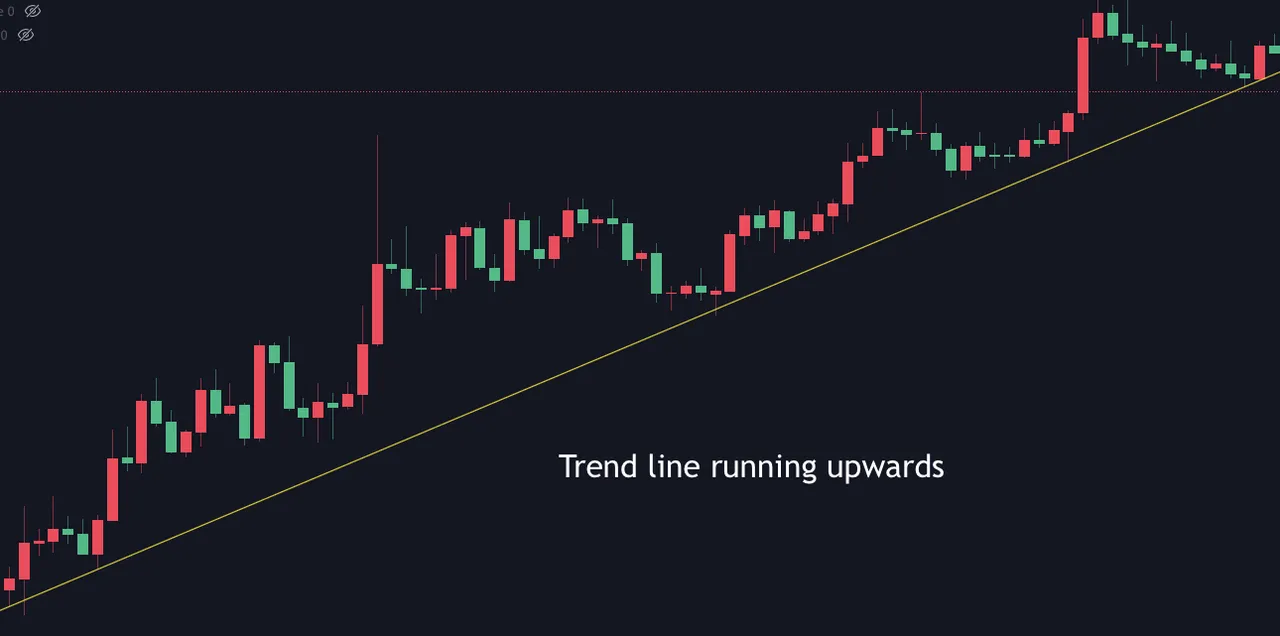
Diagonale Support- und Widerstandslinien werden auch als Trendlinien bezeichnet. Es gibt Trendlinien, die nach unten verlaufen und solche, die nach oben verlaufen.
Da der Preis eine Währung nicht in einer geraden Linie nach oben oder unten geht, sondern in Wellen, fällt der Preis manchmal auf ein bestimmte Zone zurück und setzt dann den Trend wieder fort. Der Preis ruht stoppt und setzt dann seinen Weg nach oben oder unten fort. Dies sind Trendlinien.
Eine Trendlinie kann also, genau wie horizontale Zonen, als Support oder Widerstand dienen. In der Abbildung unten sehen Sie, dass die Aufwärtstrendlinie als Unterstützung fungiert.
Keine genauen Linien
Support und Widerstand sind keine exakten Linien. Es ist nicht klug zu glauben, dass die von Ihnen gezogene Linie ein exaktes Niveau darstellt, denn so funktioniert der Handel einfach nicht.
Deshalb ist es wichtig zu wissen, dass es sich bei Support und Widerstand um "Zonen" und nicht um genauen Niveaus handelt.
Superkraft!
Wenn Sie wissen, wie Sie Support- und Widerstandszonen malen können, haben Sie einen enormen Vorteil. Es ist super kräftig, zu wissen, wie gross die Chance ist, dass der Preis die Richtung ändert oder stagniert.
Es stellt sicher, dass Sie das können:
- Reversal Trades nehmen kannst
- Trendfortsetzungen sehen
- Den richtigen Zeitpunkt für den Einstieg bestimmen
- Den richtigen Zeitpunkt für den Ausstieg bestimmen
- Und vieles mehr
Kleines Beispiel: Nehmen wir an, Sie möchten aufgrund einer Nachricht eine Long-Position eingehen, sehen aber, dass Sie nur noch wenige Punkte vom Widerstand entfernt sind. Sie wissen, dass es Verkäufer gibt, die den Preis nach unten drücken könnten. Ist es klug, dann zu kaufen?
Das glaube ich nicht 😁
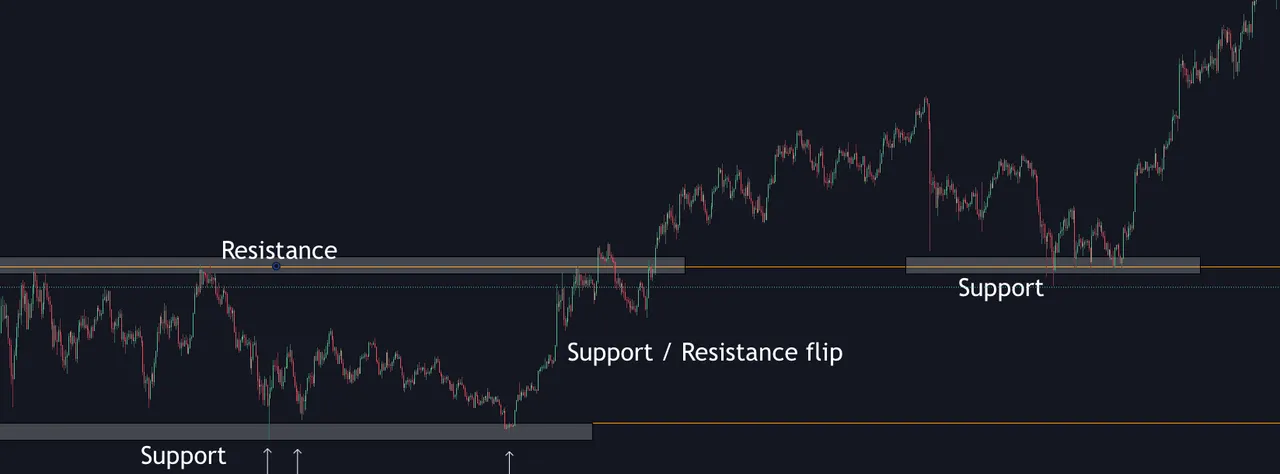
Support und Widerstand Flip
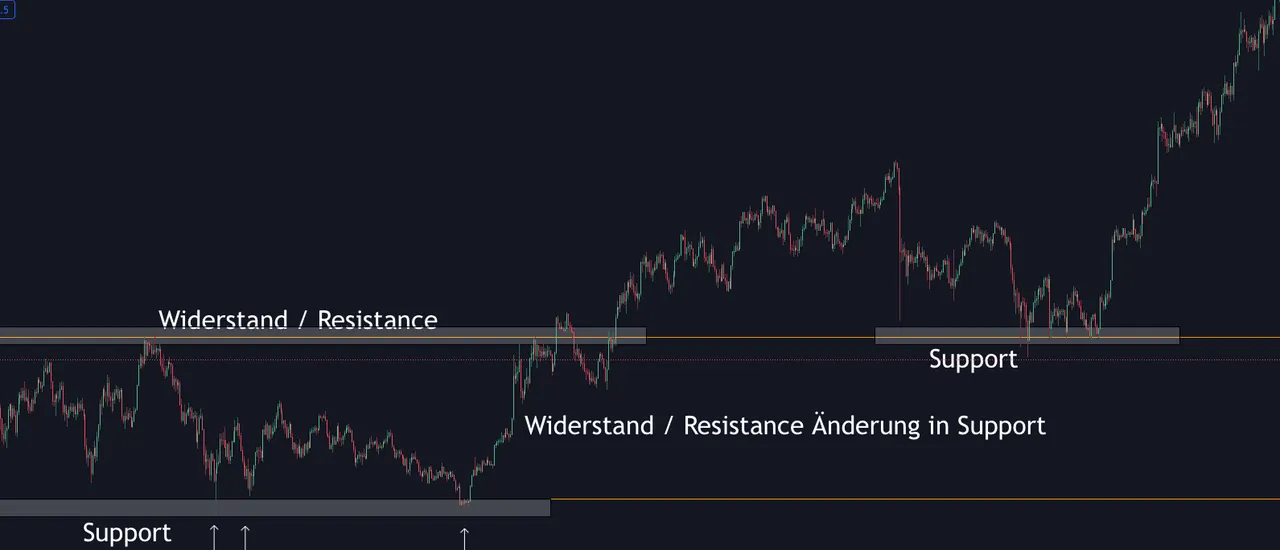
Ein Support and Resistance Flip (S/R-Flip) ist ein Phänomen, bei dem Support in Widerstand oder Widerstand in Support umschlägt. Dieser Flip tritt auf, wenn ein Support- oder Widerstandsniveau durchbrochen wird, und wenn der Kurs das durchbrochene Niveau wieder erreicht, wirkt dies wie das Gegenteil von dem, was vorher der Fall war.
Eine Umkehrung von Support und Widerstand findet nicht immer statt, wenn ein Niveau durchbrochen wird. Sie können dies bestätigen, indem Sie sich ansehen, wie der Preis reagieren wird, wenn er wieder in das Niveau eintritt. Unten sehen Sie, wie der Widerstand in Support übergeht.
Starke Support- und Widerstandsniveaus
Lesen Sie unten warum.
Ein Support- oder Widerstandsniveau besteht, weil auf einem bestimmten Niveau viele Kauf- oder Verkaufsaufträge bereitstehen. Wenn das Niveau häufiger getestet wird, werden diese Aufträge ausgeführt. Wenn sie häufiger getestet wird, gibt es irgendwann keine Kaufaufträge mehr und damit auch keine Kaufkraft. Dadurch erhöht sich die Wahrscheinlichkeit, dass das Niveau nicht gehalten werden kann. Das bedeutet, je öfter ein Support- oder Widerstandsniveau getestet wird, desto schwächer wird dieses Niveau sein.Auf der anderen Seite, wenn eine Support und Widerstand Flip stattfindet, wird das Niveau wichtig sein, wenn es häufig getestet wurde. Wenn ein häufig getestetes Widerstandsniveau durchbrochen wird und danach als Unterstützung dienen, und der Kurs nach einer Weile wieder auf die Unterstützung,das alte Widerstandsniveau zurück kehren, handelt es sich im Allgemeinen um ein starkes Unterstützungsniveau. Dasselbe gilt für eine Widerstandsniveau.
Wie findet man Support- und Widerstandsniveaus?
Indem Sie die vorangegangenen Höchst- oder Tiefststände in einem Chart miteinander verbinden, können Sie Support- und Widerstandsniveaus erkennen. Wie Höher der Zeitframe wie starker die Niveaus sind.
Es ist praktisch, eine Linie auf den Höchst- und Tiefstständen zu ziehen, damit Sie klar erkennen können, wo sich Unterstützung oder Widerstand befinden. Es ist wichtig, dass Sie dies auf den höheren Zeitframen tun, da diese wichtiger sind als die niedrigeren Zeitframen, wobei die tägliche Zeitframe empfohlen wird. Sie können dies in einem Charting-Programm mit Zeichenwerkzeugen tun. Ich selbst verwende Tradingview.
Im vorigen Kapitel haben Sie gelesen, dass ein Niveau umso wichtiger wird, je öfter es getestet wird. Suchen Sie daher in Ihrem Diagramm nach Niveaus, die mehrmals getestet wurden, und ziehen Sie eine Linie oder Box auf diesen Niveaus.
Das Gleiche gilt für diagonale Support- und Widerstandslinien, Sie verbinden die Hochs und die Tiefs miteinander. Der einzige Unterschied zu den horizontalen Ebenen besteht darin, dass Sie in diesem Fall eine diagonale Linie anstelle einer horizontalen Linie zeichnen, Dabei sind die horizontale Linien am stärksten.

(EN) Support and resistance lines why the price action stops or reverses.
Support and resistance lines are one of the most commonly used techniques for technical analysis. In fact, they allow you to retrieve important information. Information that, in theory, already puts you in a position to trade successfully.
In this post you will learn the most important aspects of support and resistance. I'll explain what it is, why it's important, how it works, how you can use it and much more!
What is support and resistance?
- Support: Support is a zone to which the price has fallen, but which is difficult to break due to greater demand at this level.
- Resistance: The resistance is a zone to which the price has risen, but where it is difficult to break through because there is more supply at this level.
The essence of support and resistance is simply supply and demand. At a support level there are more buyers (demand) than sellers (supply) and at a resistance level it is the other way around.
Example of support: When the price of a currency decreases and thus becomes cheaper, buyers see a better deal and are more inclined to buy. Sellers are then less inclined to sell because they then have to sell at a low price, which is a bad deal. So in this case, a support level is formed because the buyers have the upper hand, which prevents the price from falling any further.
Example of resistance: If the price of a currency rises and thus becomes more expensive, sellers will be more inclined to sell because the price is high. Buyers, on the other hand, will then be less inclined to buy. So in this case, there is increasing supply (more sellers) and decreasing demand (fewer buyers), which ensures that the price cannot continue to rise (resistance level) and theoretically starts to fall.
Horizontal support and resistance lines
The strongest support and resistance zones are the horizontal lines. These zones are created by high buying power at the horizontal level.
Often round numbers are also horizontal support and resistance zones. This is due to the fact that most people buy or sell with round numbers. Not only traders, but also investors.
For example, it is more plausible that people buy at the $30,000 support zone rather than at $31,270.50- which leads to the fact that there are many buyers at the $30,000 support zone. Thus, this level represents a strong support. In the figure below, you can see that the $30,000 zone is a strong support because there are many buyers.
Diagonal support and resistance lines
Diagonal support and resistance lines are also called trend lines. There are trend lines that go down and those that go up.
Since the price of a currency does not go up or down in a straight line, but in waves, sometimes the price falls back to a certain zone and then resumes the trend. The price stops and then continues its way up or down. These are trend lines.
So, just like horizontal zones, a trend line can serve as support or resistance. In the figure below, you can see that the uptrend line acts as support.
No exact lines
Support and resistance are not exact lines. It is not wise to think that the line you draw is an exact level, because that is simply not how trading works.
Therefore, it is important to know that support and resistance are "zones" and not exact levels.
Superpower!
If you know how to paint support and resistance zones, you have a huge advantage. It's super powerful to know what the chance is that the price will change direction or stagnate.
It ensures that you can:
- take reversal trades
- See trend continuations
- Determine the right time to enter
- Determine the right time to exit
- And much more
Small example: Let's say you want to enter a long position based on news, but you see that you are only a few points away from resistance. You know that there are sellers who could push the price down. Is it wise to buy then?
I don't think so 😁
Support and resistance Flip
A support and resistance flip (S/R flip) is a phenomenon where support turns into resistance or resistance turns into support. This flip occurs when a support or resistance level is broken, and when the price reaches the broken level again, it acts like the opposite of what was the case before.
A support and resistance reversal does not always occur when a level is broken. You can confirm this by looking at how the price will react when it re-enters the level. Below you can see how resistance turns into support.
Strong support- and resistance levels
Read why below.
A support or resistance level exists because there are many buy or sell orders ready at a certain level. If the level is tested more frequently, those orders will be filled. If it is tested more frequently, at some point there will be no more buy orders and therefore no buying power. This increases the probability that the level cannot be maintained. This means that the more often a support or resistance level is tested, the weaker that level will be.On the other hand, if a support and resistance flip takes place, the level will be important if it was tested frequently. If a frequently tested resistance level is broken and then serve as support, and after a while the price return to support,the old resistance level, it is generally a strong support level. The same is true for a resistance level.
How to find support and resistance levels?
By connecting the previous highs or lows on a chart, you can identify support and resistance levels. How higher the time frame how stronger the levels are.
It is handy to draw a line on the highs and lows so you can clearly see where support or resistance is. It is important that you do this on the higher time frames as they are more important than the lower time frames, with the daily time frame being recommended. You can do this in a charting program with drawing tools. I use Tradingview myself.
In the previous chapter you read that the more often a level is tested, the more important it becomes. Therefore, look for levels in your chart that have been tested several times and draw a line or box on those levels.
The same goes for diagonal support and resistance lines, you connect the highs and the lows. The only difference with the horizontal levels is that in this case you draw a diagonal line instead of a horizontal line, In this case the horizontal lines are the strongest.