Let’s take a look at the HIVE tokenomics for April 2023.
The projected inflation for 2023 is 6.5% on a yearly basis, or 0.55% on a monthly basis. As for the title says, HIVE inflation for April is almost zero. This is mostly because of the conversions.
Hive has a double currency system, HIVE and HBD, with conversions between them that add or remove HIVE from circulation on top of the regular inflation. Furthermore, the decentralized hive fund DHF, that serves as a DAO converts the HIVE that is in the DHF.
The @hbdstabilizer has also grown and it is playing an important role in the overall tokenomics, making conversions and trading on the internal market.
Because of this additional mechanics the HIVE inflation and supply can be drastically different in real time than the regular/projected one.
To be able to follow the HIVE supply we need to take a look at all the different ways HIVE is created, author, curation, witness rewards, conversions etc, then net that out with the HIVE burned from conversions, accounts fees, null transfers etc. To get the virtual supply we need to do the same for the HBD supply as well.
HIVE Created
Here is the chart.
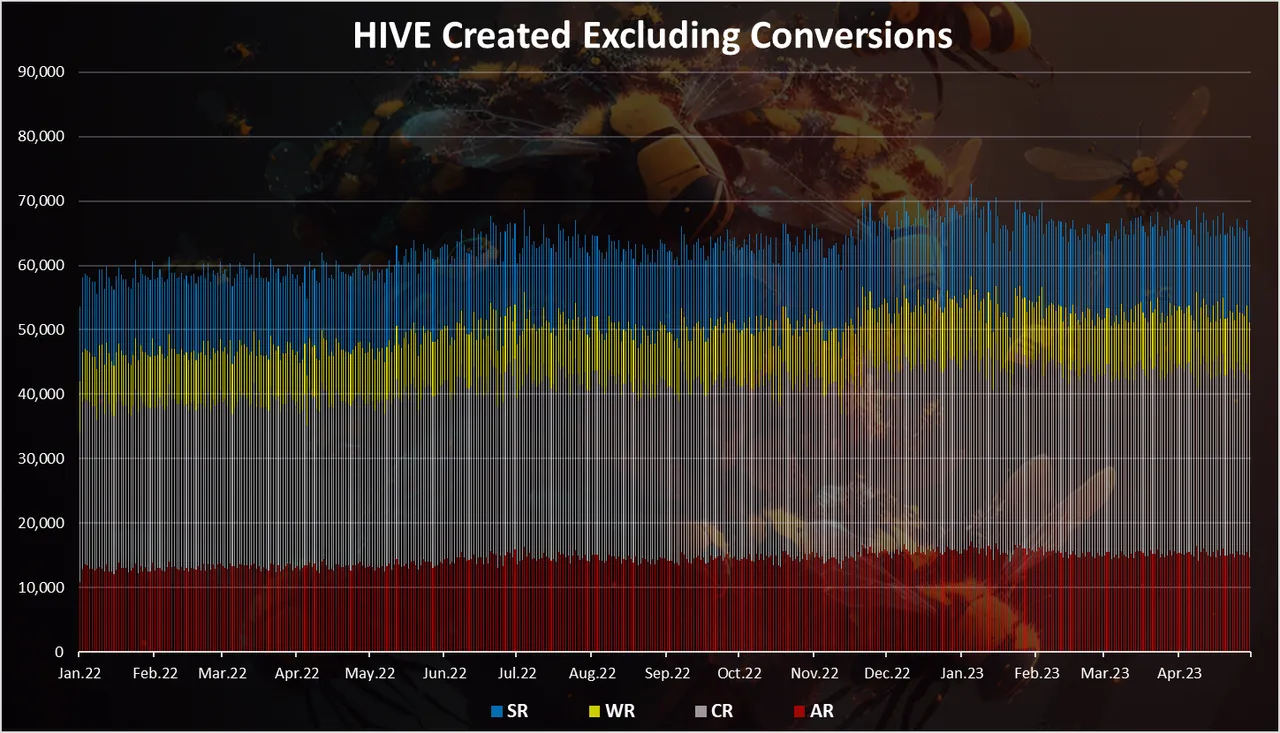
The chart above includes:
- Author rewards
- Curation rewards
- Witness rewards
- Staking rewards
These are the regular ways new Hive enters circulation, and all of them are through vested HIVE, aka powered up. You can notice the slight fluctuations in the daily amounts that is connected with the virtual hive supply, or the base for the inflation. When the price of HIVE is low, the virtual hive supply increases, and when it is up, the virtual hive supply decreases.
Thing is the conversions are playing a major role in the ecosystem. Here is the chart again, including conversions.
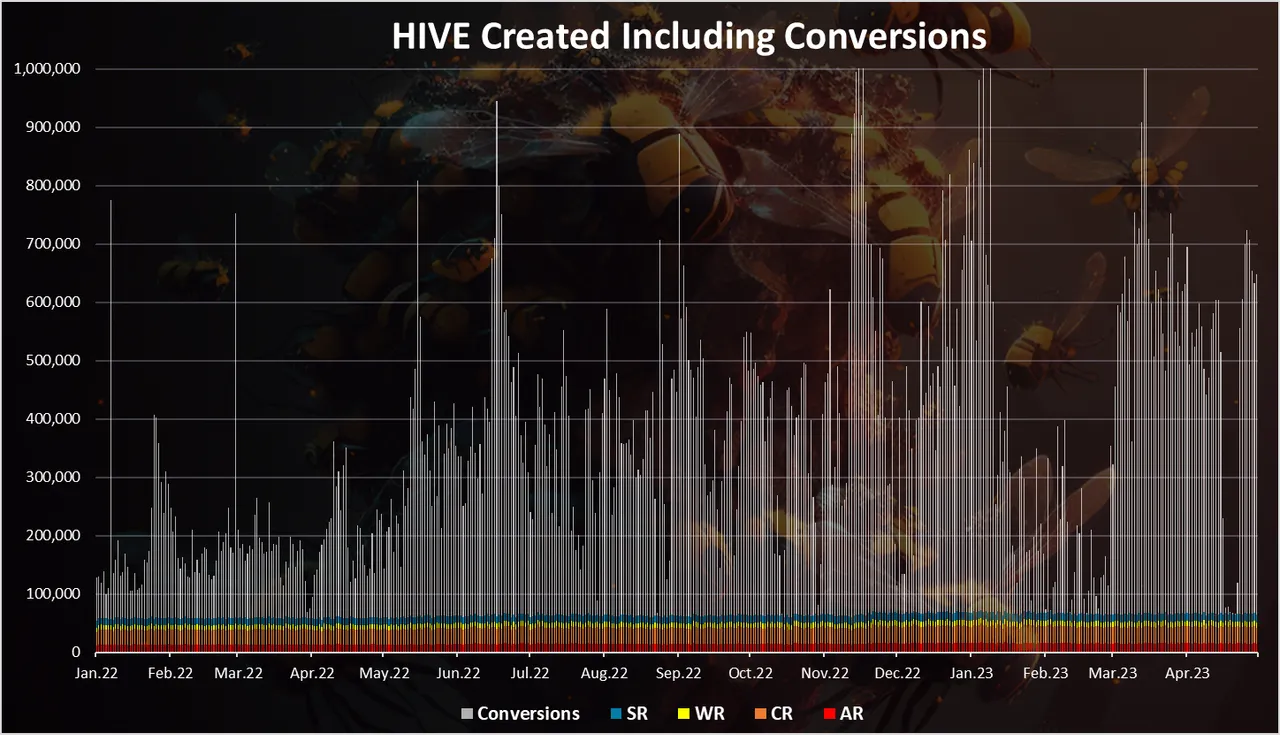
We can notice that the HBD to HIVE conversions are the dominant in the chart. This works in both ways and a big part of them is converted back to HIVE, especially through the work of the stabilizer.
The regular inflation is around 65k HIVE per day. On the other hand, the conversions averaged around 400k per day, although as noted a lot of them are converted back to HBD.
HIVE Removed From Circulation
Here is the chart.
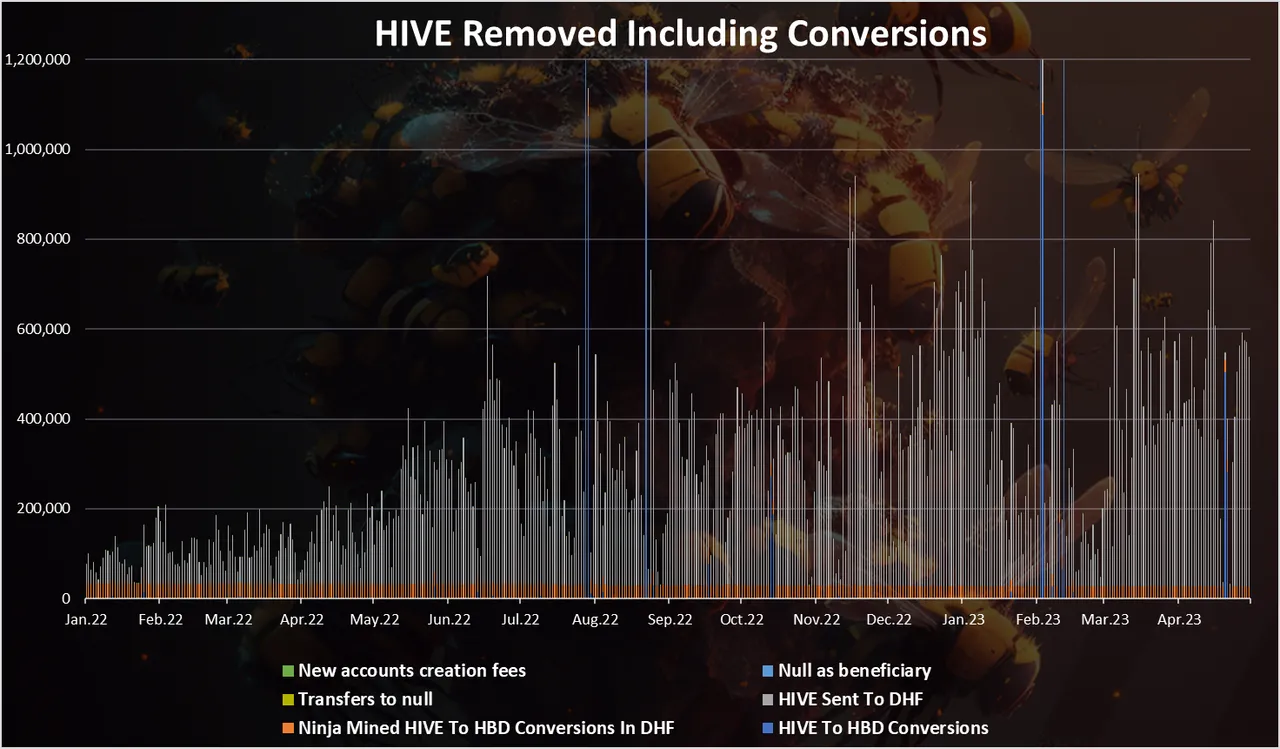
The above takes into consideration six different ways of HIVE removed
- Ninja Mined HIVE To HBD Conversions In DHF
- HIVE transfers to DHF and converted to HBD
- Transfers to null
- Null as post beneficiary
- New accounts creation fee
- HIVE to HBD conversions
The HIVE transfers to the DHF are now dominant. These are transfers made by the stabilizer. We can see a few spikes in the HIVE to HBD conversions (blue) in February and again recently in April 2023. These were due to the increase in the HBD price.
Historical HIVE Supply
When all the above is added and removed, we get this chart for the all-time HIVE supply.
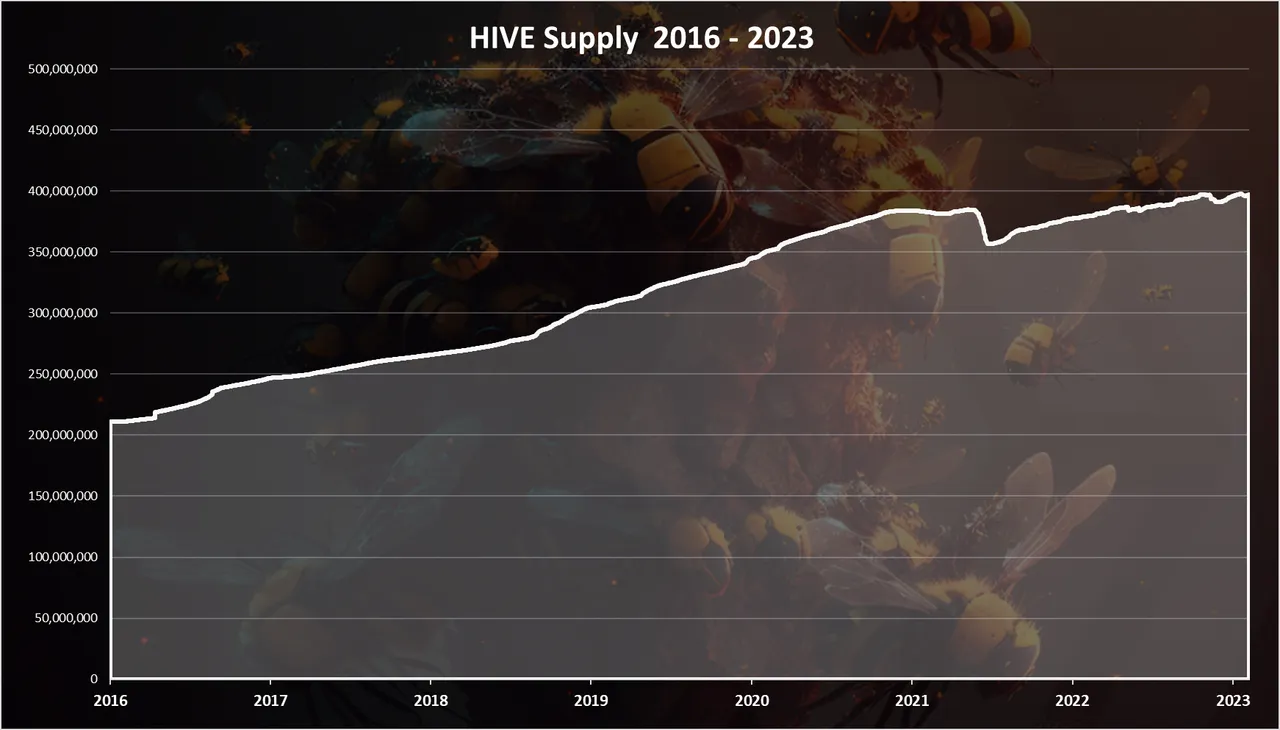
Up until August 2021, the supply was almost steadily increasing with a small fluctuation. Then a drop in the supply in September 2021. Since then, from time to time we can see some drops in the supply with the recent happening in February and April 2023.
HBD Supply
Here is the chart for the HBD supply.
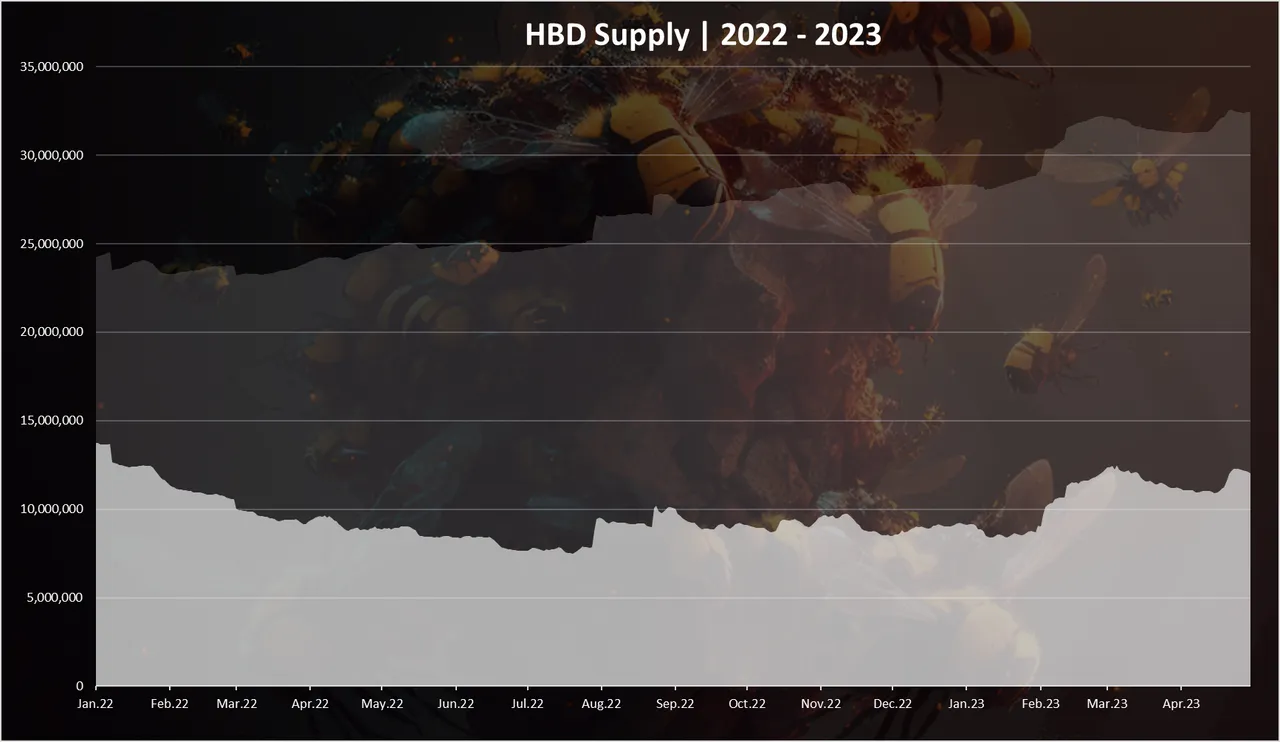
This is a chart starting from 2022.
The light color is HBD in the DHF. The HBD in the DHF is not freely circulating HBD and only enters circulation when payouts to the DHF workers are made.
HBD is being created and removed in a various way, but the conversions play the major role here in both directions. Other ways HBD is created is DHF proposal payouts, author rewards and interest.
We can see that after a downtrend in 2022, but in 2023 there was an increase in the HBD supply in February, a small decrease in March and again a small increase in April.
In April the HBD supply increased almost for 1M HBD from 11.1M to 12.1M HBD.
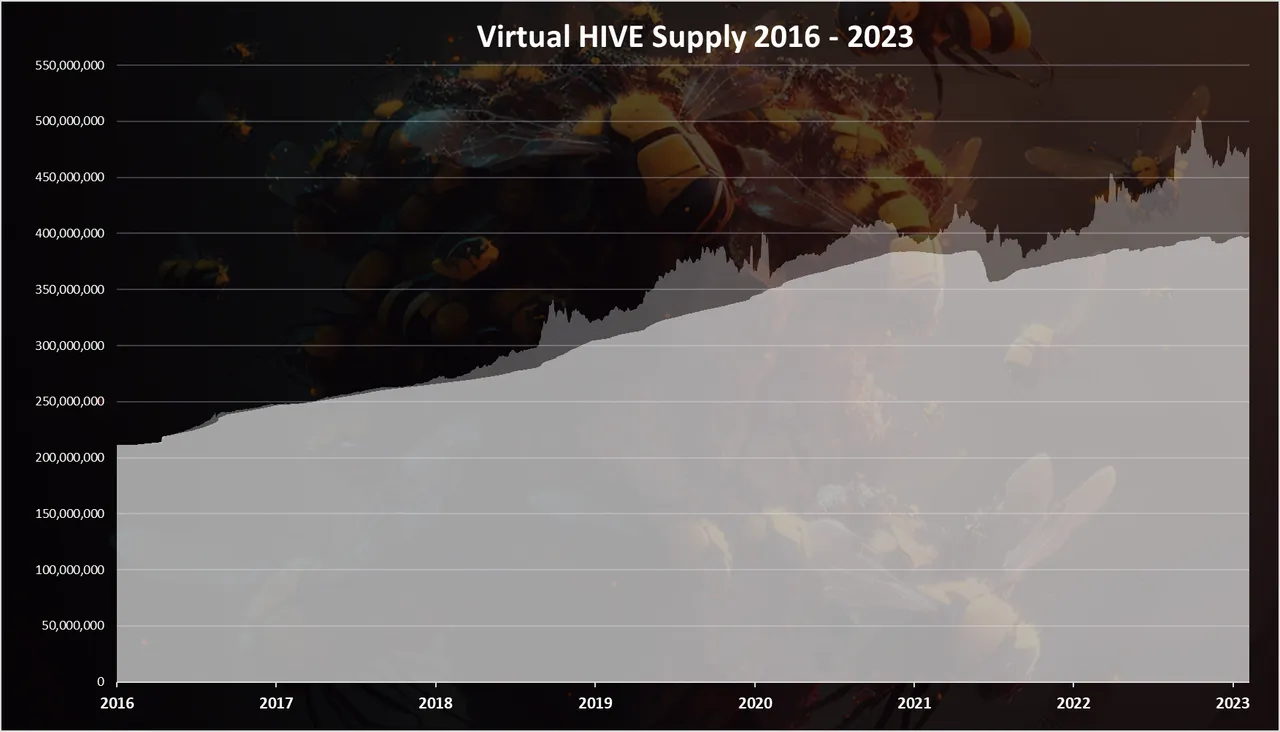
Virtual HIVE Supply
When we add the HIVE equivalent supply from the HBD to the HIVE supply we get the chart bellow.
When we zoom in 2022 - 2023 we get this:
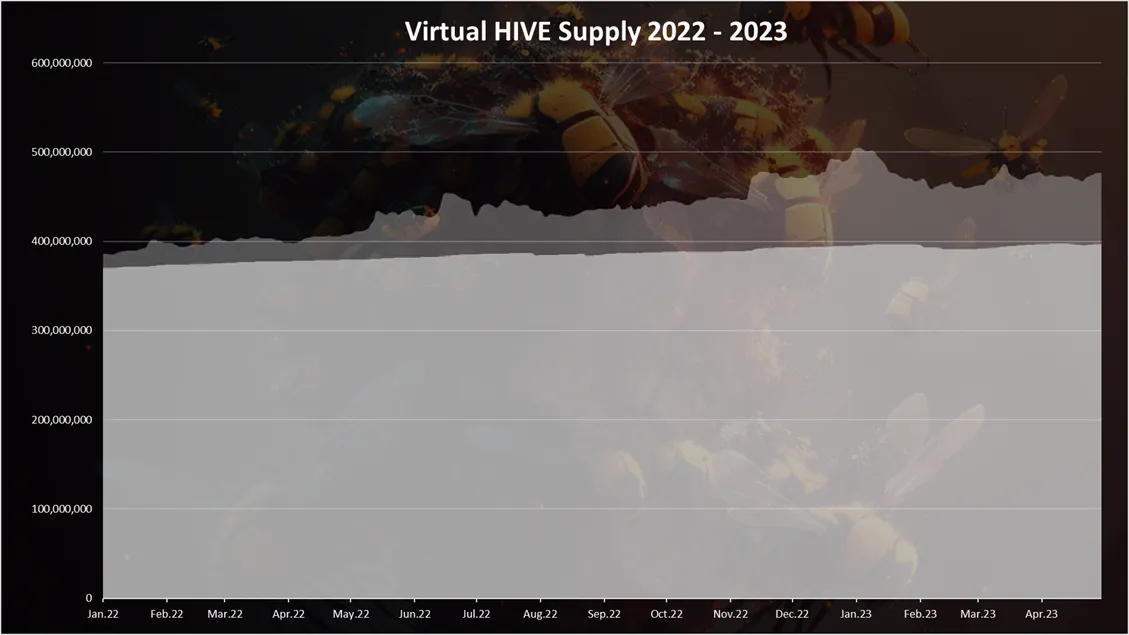
The light color is HIVE that in theory can be converted from HBD at the current market prices for HIVE.
We can see that the virtual supply fluctuates a lot, mostly because it is tied to the price of HIVE. As the price of HIVE drops, the virtual supply increases and the opposite.
In 2022 the virtual supply has increased because of the drop in the HIVE price. We can see the reversal trend in 2023 with both the virtual HIVE supply and the circulating HIVE supply going down.
Projected VS Realized HIVE Inflation In 2023
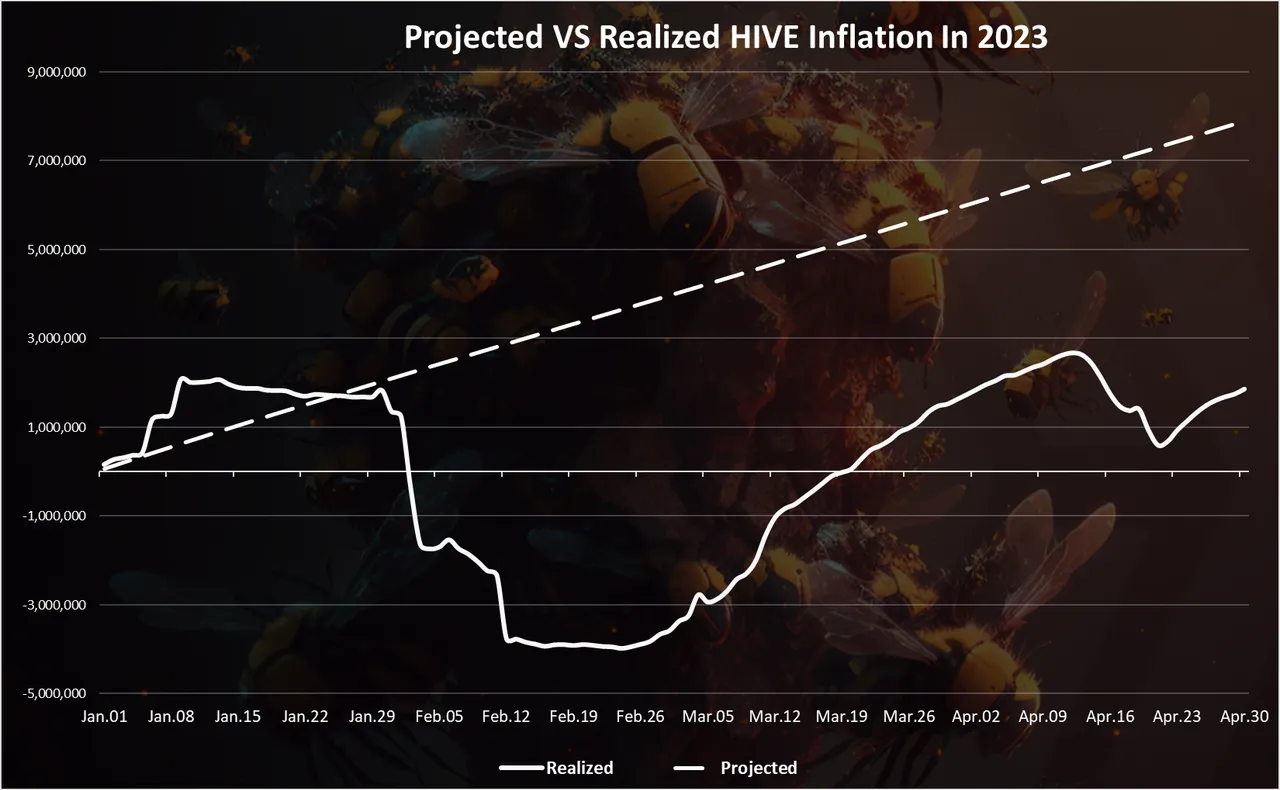
This chart is telling the story of the new HIVE entering circulation in 2023.
There was some uptrend in the first week of the year, a slow downtrend since then, and a sharp drop in February.
In March we have seen an expansion in the HIVE supply and then a downtrend again in April, especially around April 20 when there was a demand for HBD.
A cumulative 1.8M HIVE added in 2023, lower than the projected one, that would have added around 8M new HIVE up to April.
Monthly Inflation
If we plot the monthly inflation, we get this.
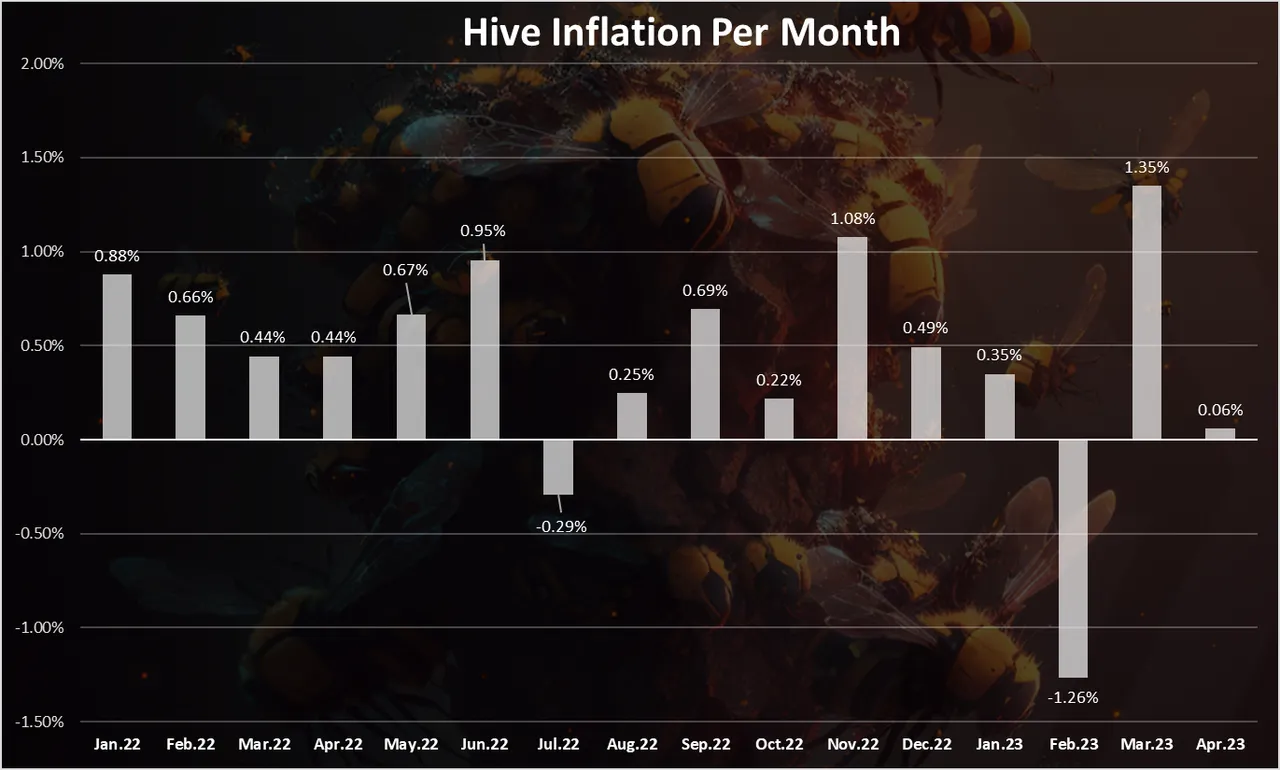
2023 has been interesting. January had a small positive inflation, February a negative one, that was offset by the positive inflation in March, and now April is almost at zero, or 0.06% to be more exact.
In terms of absolute numbers the HIVE supply in April has increased from 396.6M to 396.9M, adding 300k HIVE in circulation. For comparison the projected monthly inflation is around 2M HIVE.
Yearly Inflation
The yearly, projected and realized inflation looks like this.
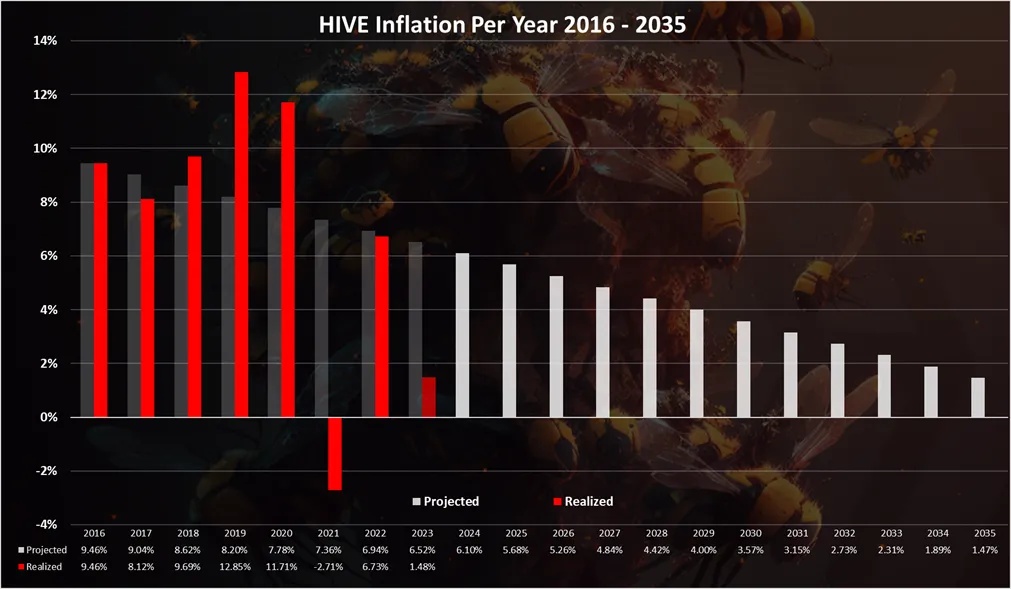
Hive is still below the projected line for inflation in 2023. From the first four months, Hive is on the way to end around 1.5%, that is below the projected 6.5%. We are still early in 2023, so a lot can change in the coming months.
Net HIVE Created By Category In April 2023
Here is the new HIVE put in circulation by category for the month.
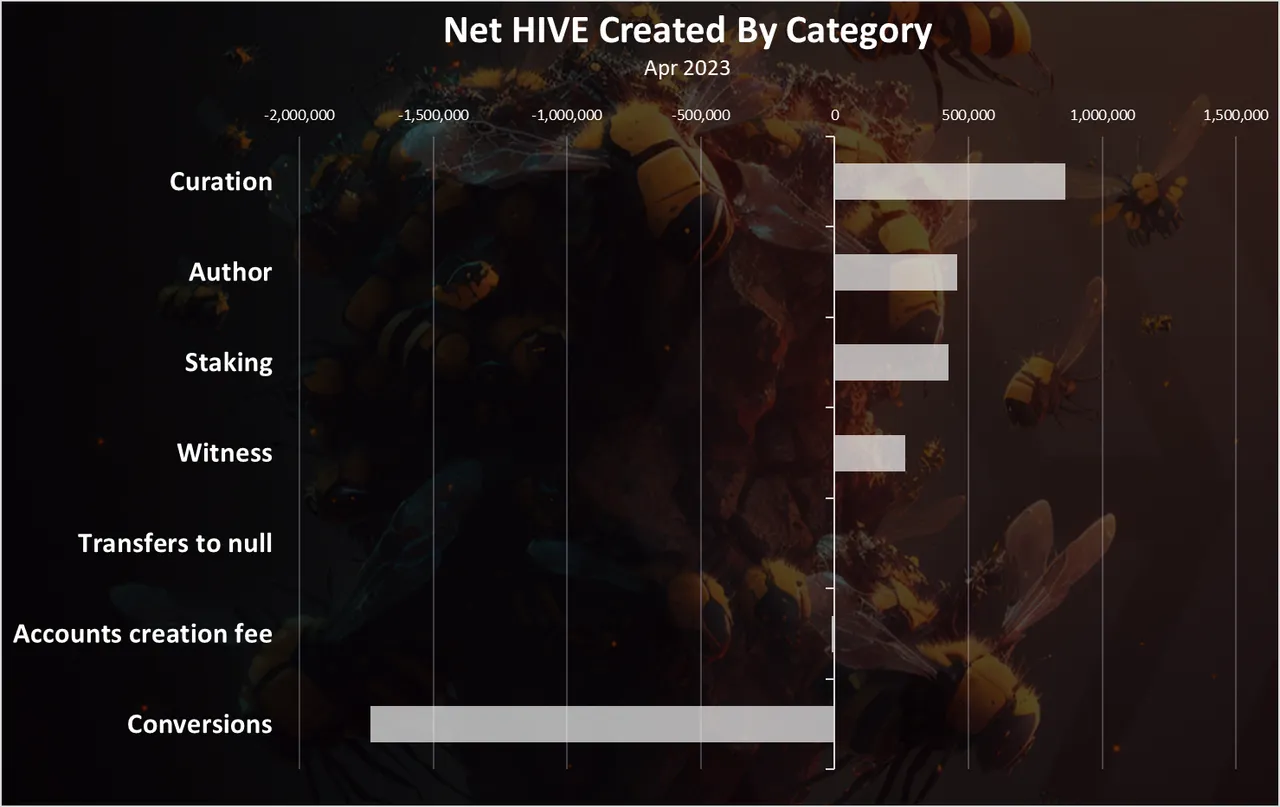
The curation rewards are on the top for the month with 860k HIVE.
The conversions are negative with -1.7M HIVE removed from circulation. This is mostly because of the small spike in the HBD price that happened around April 20th, but was enough to trigger conversions and arbitrage for HBD.
All the best
@dalz