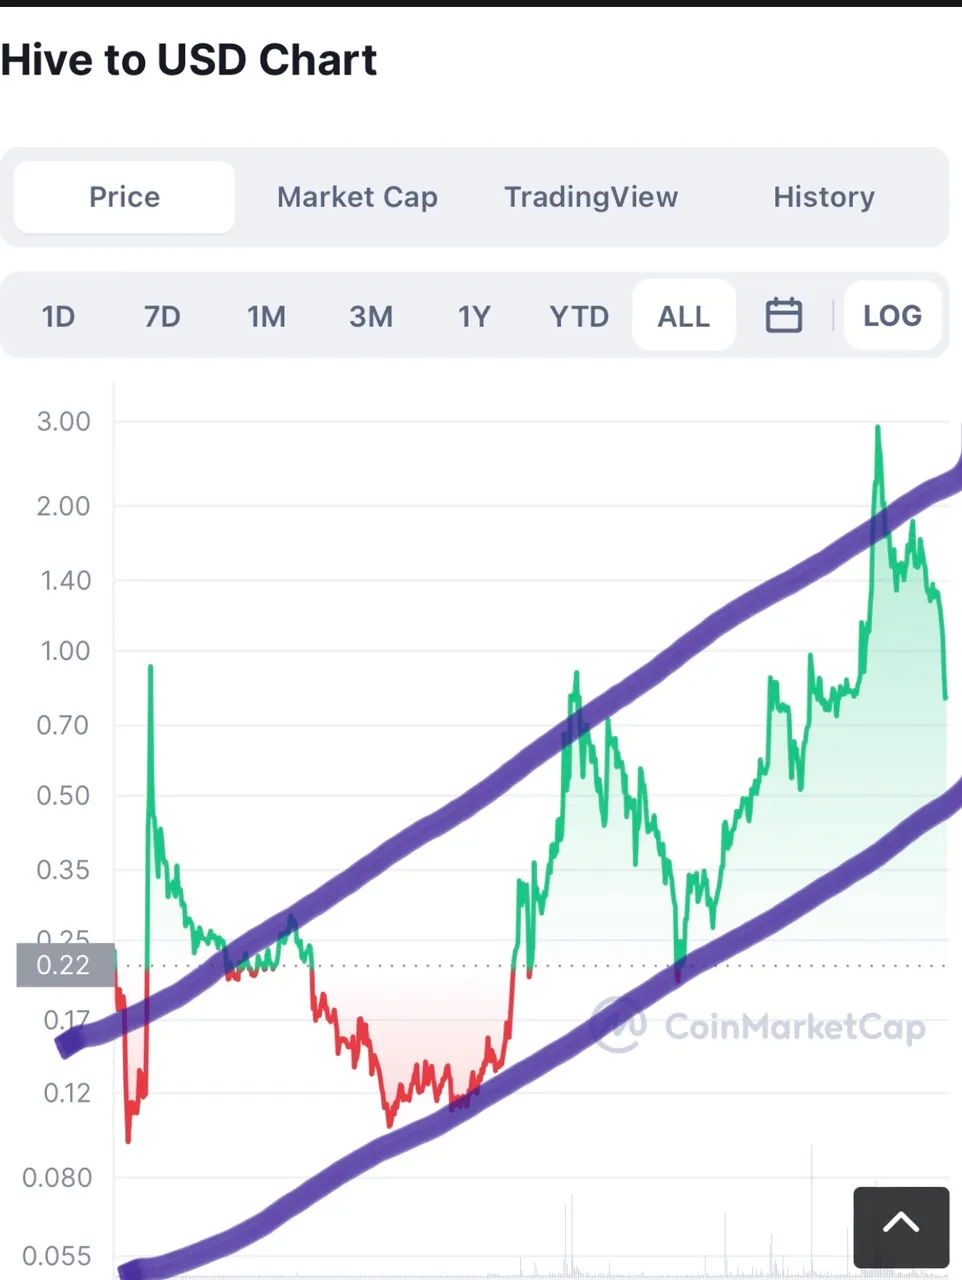
I do not have too much to say about this chart, but I did find it interesting. This is an all time HIVE graph in log scale. If this graph means anything (which it probably doesn’t), then the next low will be ~$0.50 to $0.60 range.
I do not have too much to say about this chart, but I did find it interesting. This is an all time HIVE graph in log scale. If this graph means anything (which it probably doesn’t), then the next low will be ~$0.50 to $0.60 range.