So, this idea of hyperwaves fascinates me. Knowing which stocks/cryptos are in a hyperwave and when it's going to end seems like a way to make an absolutely massive killing, and even more importantly let's someone know when is the right time to get out.
Basics of a Hyperwave
A hyperwave is a way to describe how a bubble is going to operate. At certain times you have price points the bubble won't go above and at other times you have price points where it won't go below. The rate of minimum price changes during a time segment are roughly known.
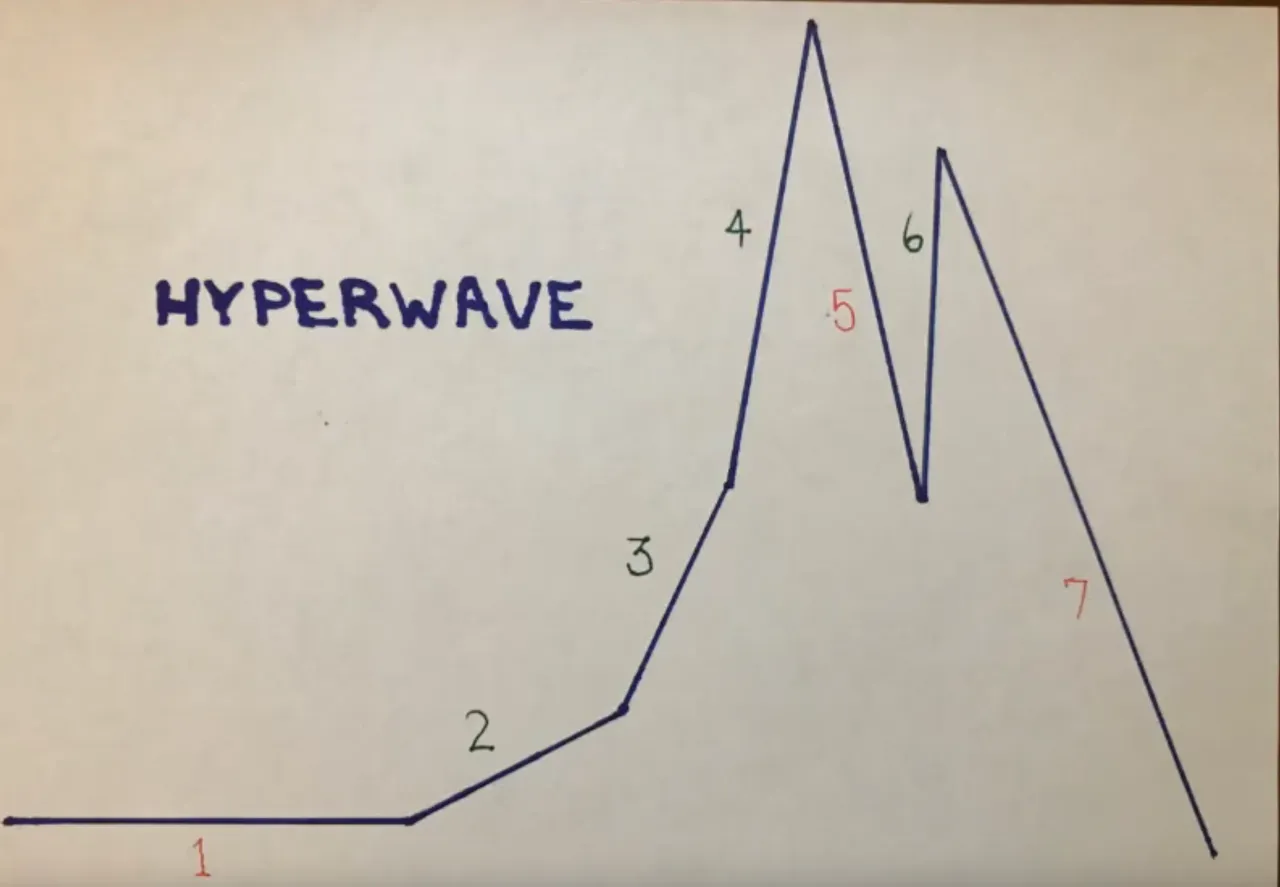
1,4,7 the price stays below the line. 2,3,5,6 the price stays above the line. With this information at hand you know either minimum or maximum evaluations during a week+ trading session. It arms you with half the knowledge you need to make perfect trades.
Weekly Chart for Amazon
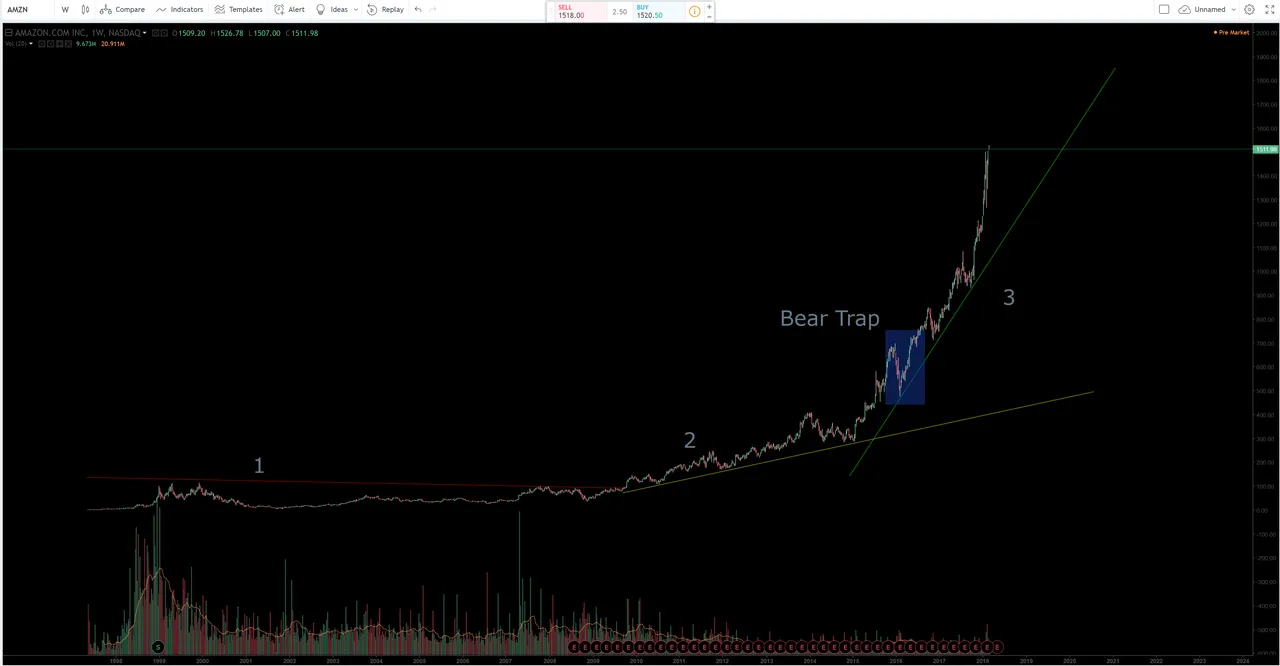
First, this is a weekly chart, notice how long this is taking. Compare that to bitcoin and it makes more sense why our swings are a lot more. We're apparently doing this hyperwave thing, but at an accelerated pace. Bitcoin isn't a confirmed hyperwave. Tyler Jenks, creator of this technical analysis approach to studying bubbles likes to see 3-4 hits on the wave 3 trendline that are repelled before he's signalling the green light on a hyperwave.
Likelihood
There are a few thousand stocks etc that have a long period of no price movement.
There are fewer that move into wave 2. Those in 2 really only have a 1/5 chance to move on to the next round before they collapse.
Those in wave 3 (after a few touch points) have a 85% chance or greater of completing the full hyperwave.
Those that reach stage 4 nearly always complete the full cycle (crash hard!!!)
You can learn more about Hyperwaves here
You can get the intro lesson here: