Theory
The typical price of an asset is an arithmetic average of the high, low and closing prices of the asset for a given period. The formula for typical price is given by:
Implementation
It's safe to assume we'll be calculating the typical price for more than one time period at once, so we can take advantage of the optimizations in numpy arrays. We define a function to calculate the typical price of a stock as follows:
import numpy as np

def typical_price(ohlcv):
    """
    Calculate the typical price for a stock from the candlestick data

    Inputs:
        ohlcv:  numpy array -   A 5 x N matrix with rows corresponding to
                                open, high, low, close, volume respectively
    Outputs:
        price:  numpy array -   The typical price signal
    """

    return (1/3) * (ohlcv[1, ::] + ohlcv[2, ::] + ohlcv[3, ::])
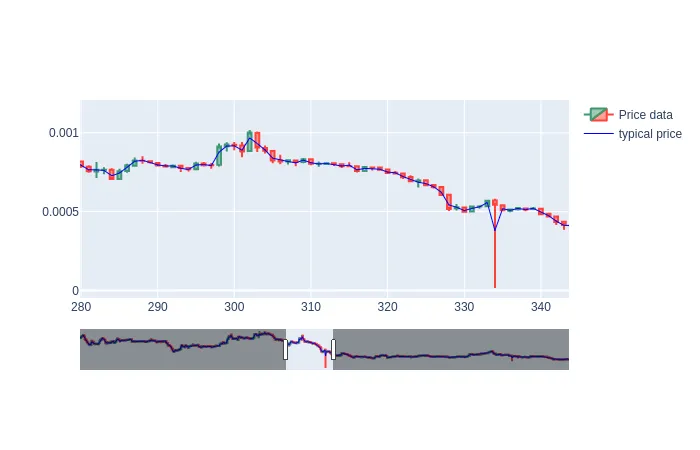
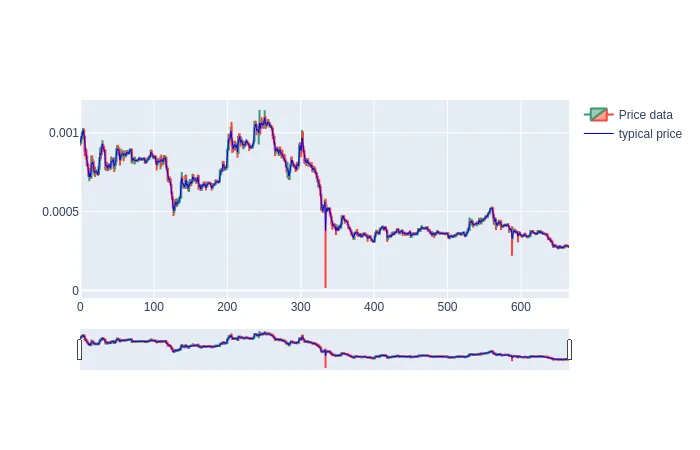
Plot
Plotting the result of this function for an arbitrary asset (in this case BTC vs EOS) yeilds something similar to the figure below.