Hello Steemians! About a month ago, I posted my thoughts on the stock market and talked about the correction that the stock market is undergoing. Let's take a quick look at how the S&P 500 is doing.
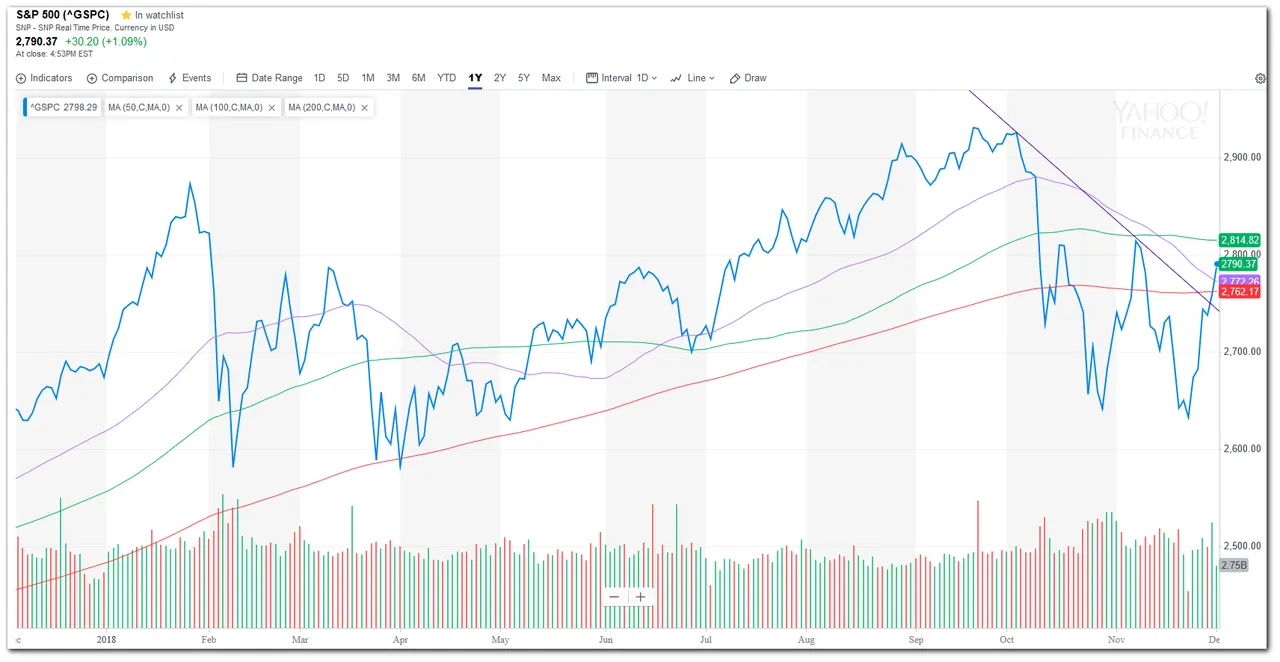
For the past month, volatility was high and you can see how the index whipsawed from the low of 2600+ to the high of 2800+. Yesterday, the index rose sharply on optimistic news regarding the trade war truce between USA and China. For those who only read the headlines, it may seem like a very positive news. But if you have the impression that the trade war is over, then you might want to read the details. The temporary cease fire is only for 90 days, after which, the possibilities of new tariffs remain high.
Treasury Yields Inversion
Another important event happened quietly in the background amidst the cheers in the stock market. The spread between 3- and 5-year yields fell to negative 1.4 basis points Monday, dropping below zero for the first time since 2007. This means that longer term bonds are yielding lesser returns are as compared to shorter term bonds. The implication of this phenomenon is that market participants are getting less bullish on the longer term future. I quote Ray Dalio's book, "A Template For Understanding Big Debt Crises"
Typically, in the early stages of the top, the rise in short rates narrows or eliminates the spread with long rates (i.e., the extra interest rate earned for lending long term rather than short term), lessening the incentive to lend relative to the incentive to hold cash. As a result of the yield curve being flat or inverted (i.e., long-term interest rates are at their lowest relative to short-term interest rates), people are incentivized to move to cash just before the bubble pops, slowing credit growth...
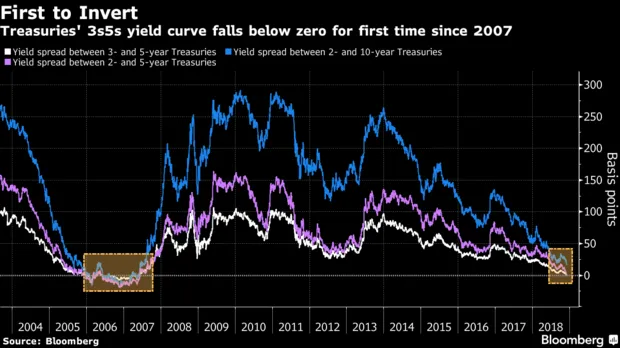
This is a sign that the market is topping (reaching its peak) and as market moves in cycles, what follows after a top is usually a depression. In addition, the inversion of yield curve has preceded all 9 of the previous USA recessions. The good news is recession does not come immediately after yield inversion, there is usually a lag of 6 months to 2 years based on past statistics.
Shiller PE and Buffett Indicator
Let's again look at where the Shiller PE and Buffett Indicator are standing.
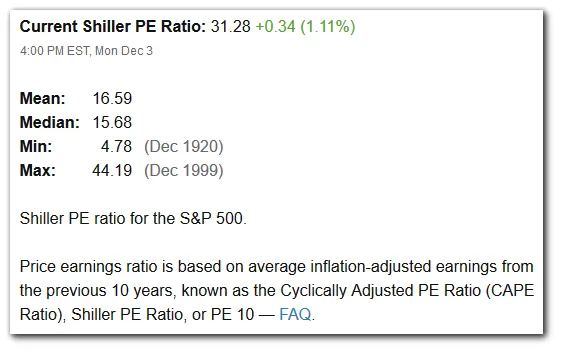
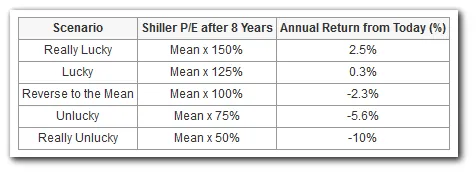
1 month ago, the Shiller PE was around 30. Now it is a little higher at 31. We are still greatly overvalued based on this metric. As a refresher, the Shiller PE tends to revert to its mean on the average over 8 years. At the current level, it is still likely that we will lose 2.3% annually if it does go back to mean after 8 years.
Next, lets take a look at the Buffett Indicator. Based on source from GuruFocus, we are still significantly overvalued.
As of 2018-12-03 (updates daily):
The Stock Market is Significantly Overvalued. Based on historical ratio of total market cap over GDP (currently at 136.7%), it is likely to return -1.5% a year from this level of valuation, including dividends.
Conclusion
Markets move in cycles, holding a relatively contrarian view, when the mainstream media are sounding all bearish, I believe that there will be a short term stock market bounce to all time high. However, we need to keep in mind that the market is still overvalued with signs of upcoming recession. Thanks for reading and let me hear your thoughts on the stock market.

Projects/Services I am working on:
You can find me in these communities: