I/O Coin (IOCBTC) has broken out of the triangle pattern in the four-hour chart.
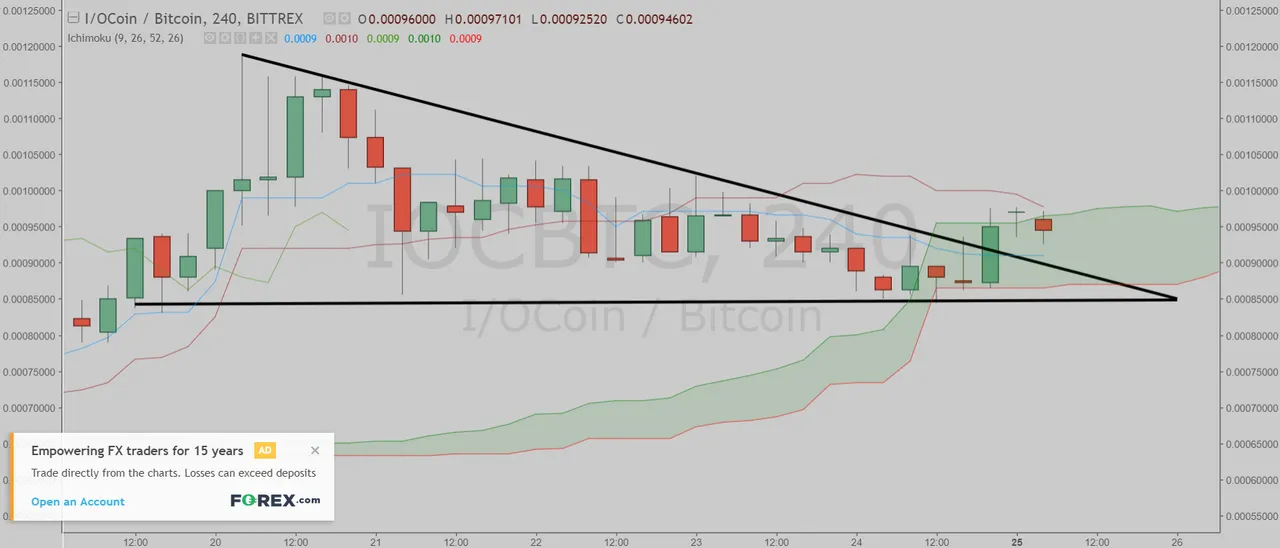
(Chart courtesy of Tradingview.com)
In Elliott Wave terms, I/O Coin began a wave one advance on September 4. The wave one finished on September 13, and the wave two correction ended on September 15. The wave three advance finished on September 20, and the wave four correction ended on September 24. If this wave count is correct, I/O Coin should be heading next towards the September 20 peak in the wave five.
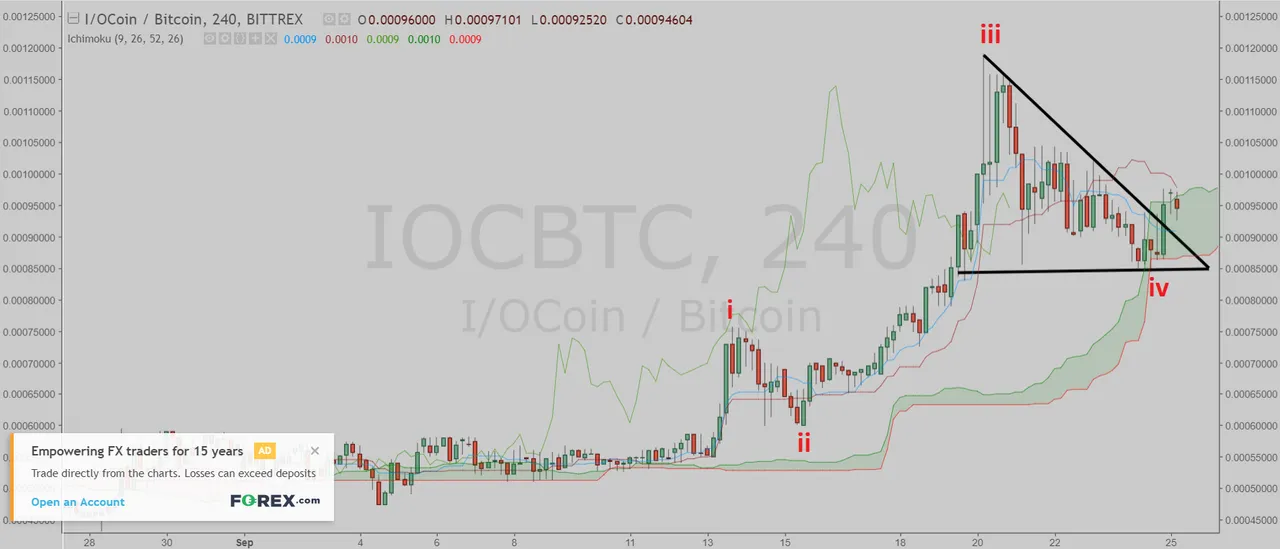
(Chart courtesy of Tradingview.com)
Zooming out in the weekly chart, I believe I/O Coin is currently in the red wave five (blue sub-wave iii).
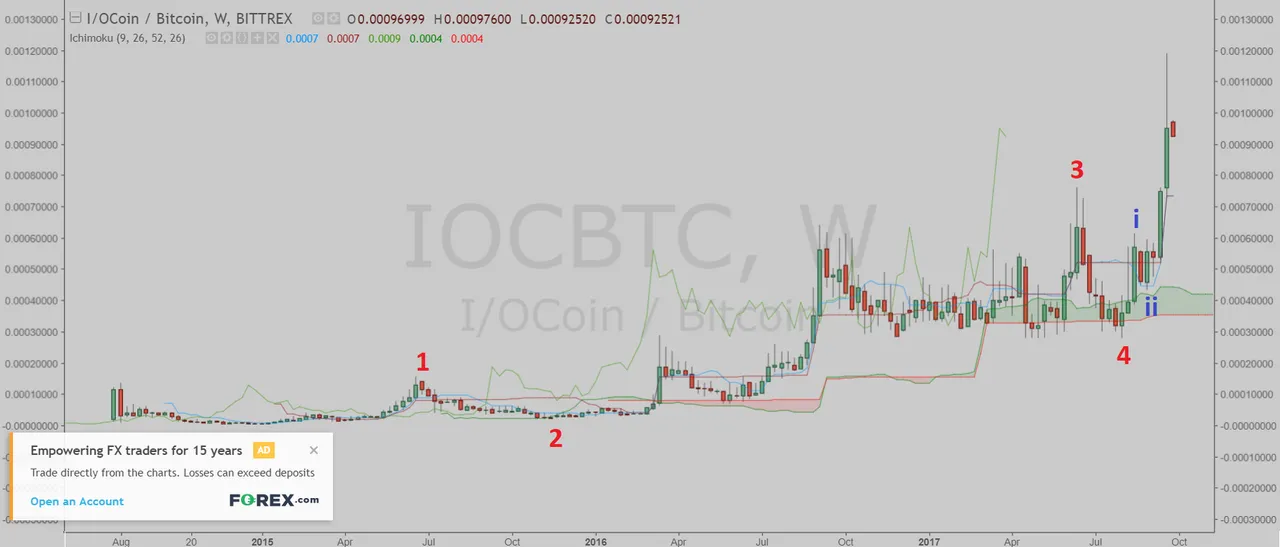
(Chart courtesy of Tradingview.com)

If you think this analysis is correct, upvote this post and upvote the comment "I/O Coin will takeout the September 20 peak".
If you think this analysis is wrong, upvote this post and upvote the comment "I/O Coin will drop below the September 4 low".
If you think I/O Coin is in a range, upvote this post and upvote the comment "I/O Coin will stay in a trading range between the September 4 low and the September 20 peak until October 26".
You can upvote the comment until 3 PM EST September 26 and you can upvote only one comment. 50% of SBD from this post will be distributed equally to the winners. The winners will be determined by the price action (which one happens first).