SUMMARY
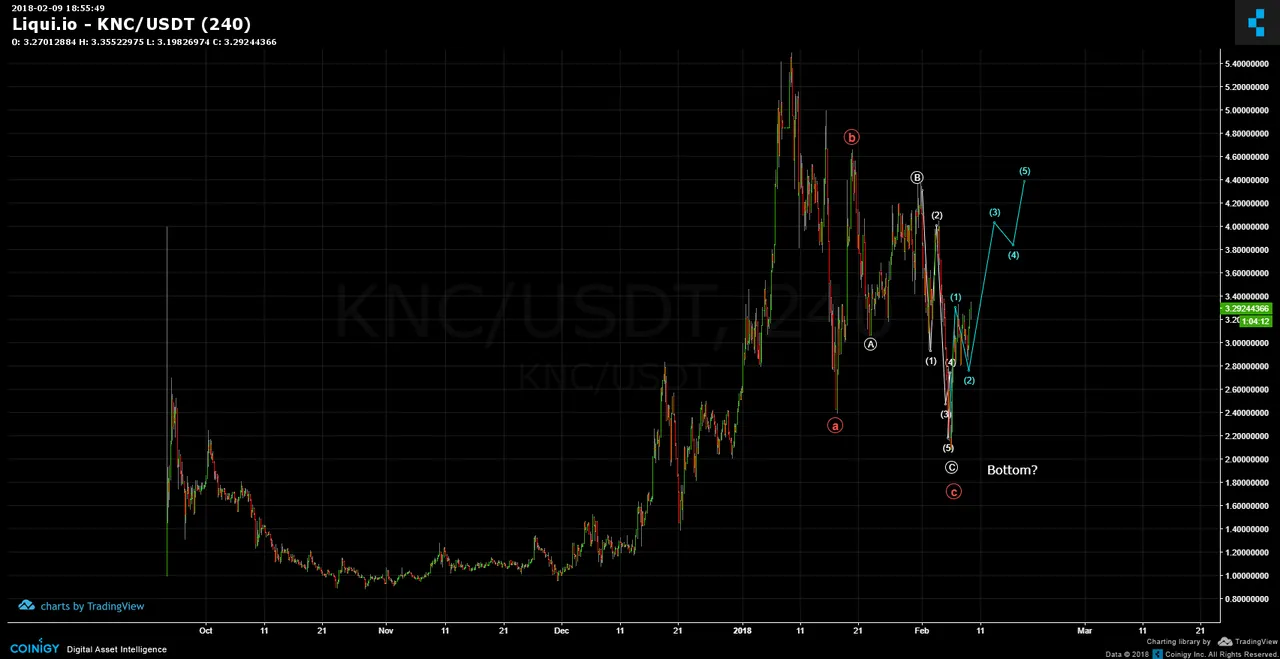
Kyber Network (KNC) put in an abc correction as a flat (3,3,5). The subwaves of the final C wave breaks into white abc and then fives, as shown in below chart. It does seem very much like a bottom and that would require 1,2,3,4,5 (blue) impulse to confirm. The earliest sign of a trend reversal is an impulse in the opposite direction of the correction.
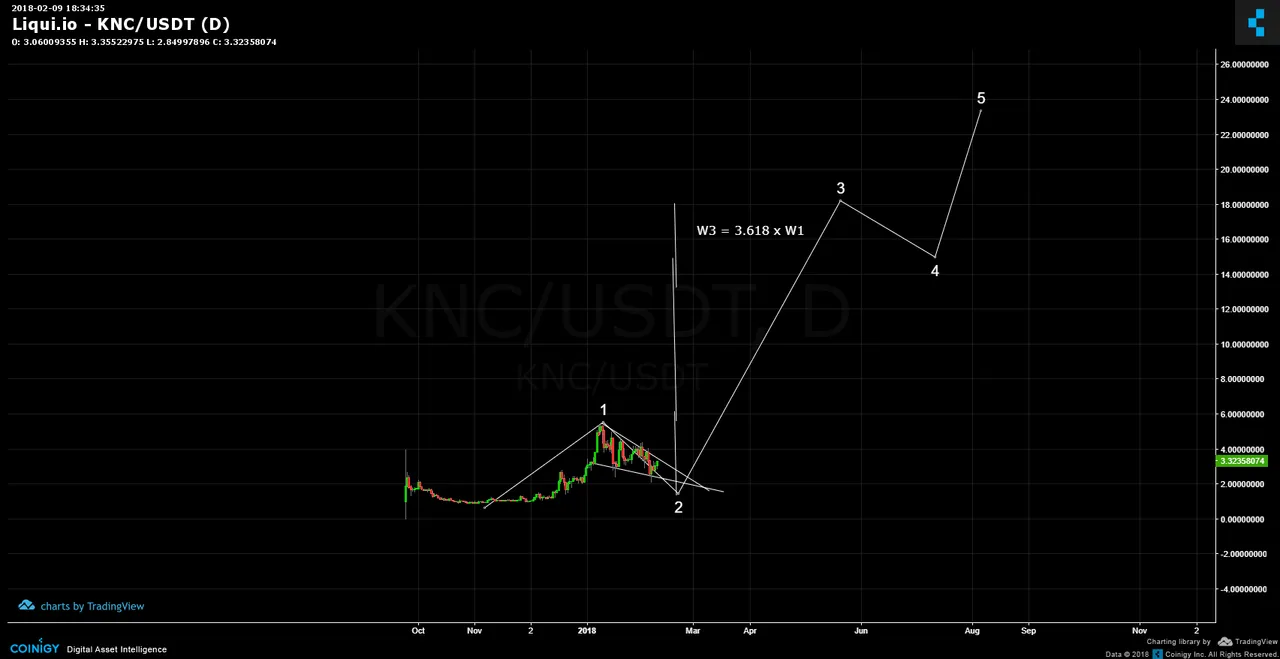
I'll venture to put out a longer term, intermediate degree of trend (multi weeks to months). The big picture shows that wave 1 is complete and 2 is in progress. Perhaps 2 is not yet complete and so lower lows would not be surprising. I've taken the vertical height of wave 1 and extended it 3.618 to generate an approximate Fibonacci based target for wave 3. The longer term prospect for Kyber Network seems favorable. Remember, this is a many weeks to months degree of trend, so expecting an overnight result would be unreal.
Legal Disclaimer: This is only my opinion, make of it what you wish. What does this mean? It means it's not advice nor recommendation to either buy or sell anything! It's only meant for use as informative or entertainment purposes.
Please consider reviewing these Tutorials on:
Elliott Wave Counting Tutorial #1
Elliott Wave Counting Tutorial #2
Elliott Wave Counting Tutorial #3
Laddering and Buy/Sell Setups.
Laddering Example with EOS
Tutorial on the use of Fibonacci & Elliott Waves
@haejin's Trading Nuggets
Essay: Is Technical Analysis a Quantum Event?
Follow me on Twitter for Real Time Alerts!!
Follow me on StockTwits for UpDates!!
--
--

If this blog post has entertained or helped you to profit, please follow, upvote, resteem and/or consider buying me a beer:
BTC Wallet - 1HMFpq4tC7a2acpjD45hCT4WqPNHXcqpof
ETH Wallet - 0x1Ab87962dD59BBfFe33819772C950F0B38554030
LTC Wallet - LecCNCzkt4vjVq2i3bgYiebmr9GbYo6FQf
