Was reading some research and the creator discussed how they have used fibonacci levels to make very good crypto investments.
The posts covered several different fib levels and how to use them, but there was one in particular that caught my eye, especially given it potentially is playing out on the chart of a alt coin I'm in.
Golden Zone...
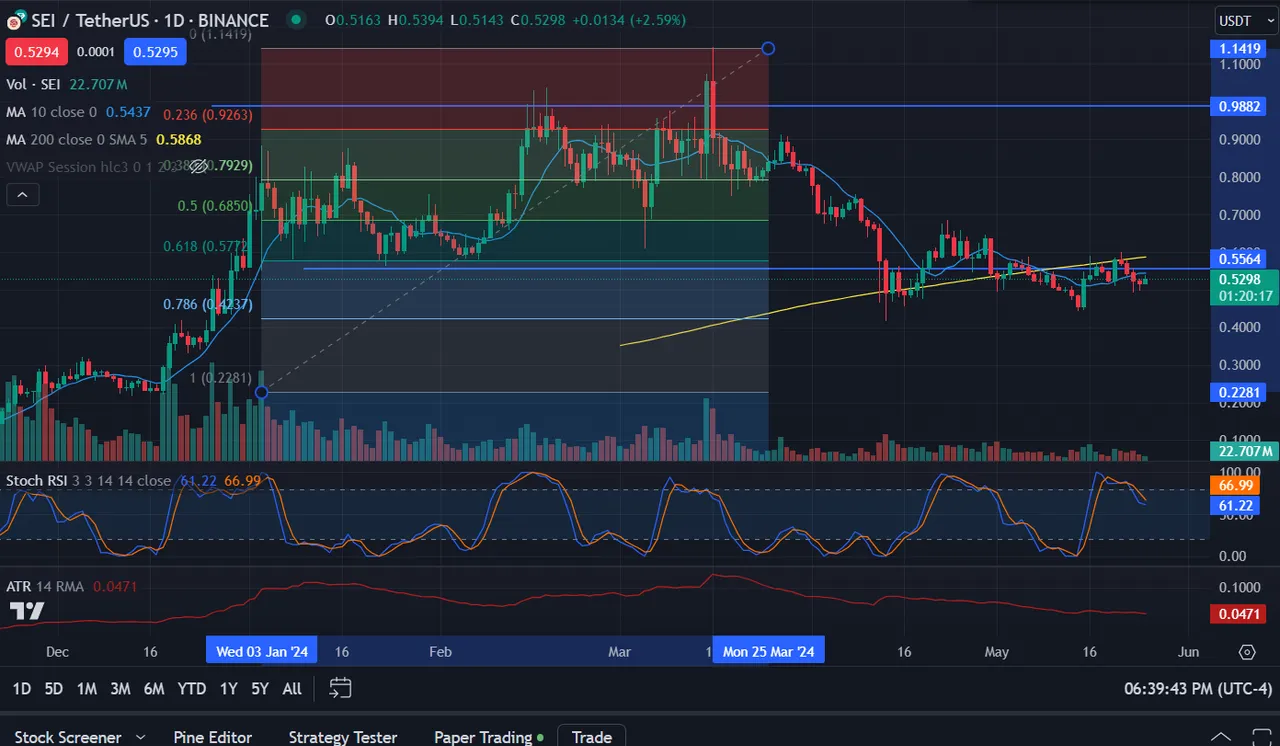
So based on the info the .6 to .618 fib level is a really good buying spot after we see a pullback from swing highs.
Now, logically I would think this doesn't make sense as at that point price has basically broken an uptrend and taken out key support levels. However, it is also the point where we see most of the sellers having already sold and where there is that fake "this thing is toast" before we magically get another leg and push to a new swing high.
I'm already in SEI so gonna watch it as my test dummy with it just happening to fall into this setup. Who knows if it will play out, but if so the upside target is supposed to be the 1.68 Fib level which would take this coin to 1.60 or so.
Something to keep me entertained while waiting for # to go up.