Part 1: Fluorescence spectroscopy, Calmodulin mutant F89L as example protein.
Steemit exclusive biomeasurement theory.
Fluorescence is a common photochemical process whereby electrons in simple elements, minerals or different biomolecules absorb and emit light in the visible spectra.
Electrons in their ground states (S0) can absorb visible light (hv) and store the energy by going to an excited electronic singlet state (S1´), as shown in the figure 1
[1] S0 + hv(exitation) → S1´
The energy stored in the excited state S1´will only partially be emitted as light, as a part of the energy will be converted to rotational and vibrational energy during its relaxation time, 𝛕0, generally 1-10 ns . The lower energy state, prior to emission, is called a relaxed singlet excited state S1, figure 1
[2] S1´→ S1
[3] S1→ S0 + hv(emission)
After the relaxation time, the relaxed singlet excited state returns to its ground state S0 but as a consequence the emitted light will be higher in wavelength compared to the absorbed light (Figure 1)
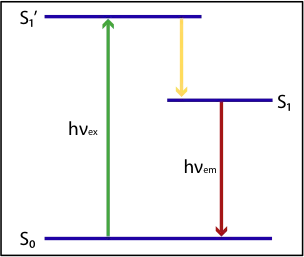
Fiure 1: The process of fluorescence.
1:Excitation, absorbing light.
2: Energy lost due to rotational and vibrational increase.
3: Emission, emitting light.
To study a protein, it must contain optically active amino acids such as aromatic compounds. They have a high optical activity and amino acids such as tyrosine, histidine, tryptophan and phenylalanine are well studied and have known excitation wavelengths along with their emission maximas. The aromatic rings of these amino acids absorb light around 275-295 nm.18
When structural changes occur to e.g. a protein, there is a possibility that some of the newly exposed regions will quench the fluorescence signal of a nearby located amino acid. When adding a quencher or changing the structure of a protein to expose a quencher, an alternative way of going from the excited state S1 back to the ground state S0 is added.
[4] S1 + Q0 → S0+ Q1
Titrating an active quencher into a solution that’s being measured will give a nonlinear decrease in the measured signal. Titrating a denaturant to expose a quencher will have the same results if it is quenching the measured signal.
The properties described above are highly usable when studying interactions between proteins and different probes or ligands as well as conformational changes within a protein's structure. When studying CaMC upon activation by calcium, the structural changes exposes tyrosine 138 and makes it possible to monitor changes in emission. The titration of CaCl2 to a solution of CaMC will increase the signal intensity from tyrosine 138 if calcium successfully binds. The tyrosine emission from CaMC should be measured around 306 nm where its emission maxima resides and the excitation wavelength is at 277 nm.
To be able to evaluate the affinity for calcium, calcium must be titrated in known proportions to the sample containing CaMCF89L. The more calcium needed to reach saturation, the higher Kd value CaMCF89L has. To know the actual emission intensity at saturation, one can simply prepare and measure a saturated sample.
To determine a certain protein’s stability, measuring the signal from aromatic residues as the protein unfold is a useful method. The signal should be less intense after the aromatic groups are exposed to hydrophilic surroundings. The emission from tyrosine 138 in CaMWT will lose intensity when the protein unfolds, as a result of being holo-structure dependent. By adding a denaturant by titration, the plot will give a Cm estimate, proportional to the concentration at the point of 50% denaturation.