The guys from the VisualCapitalist website did it again.
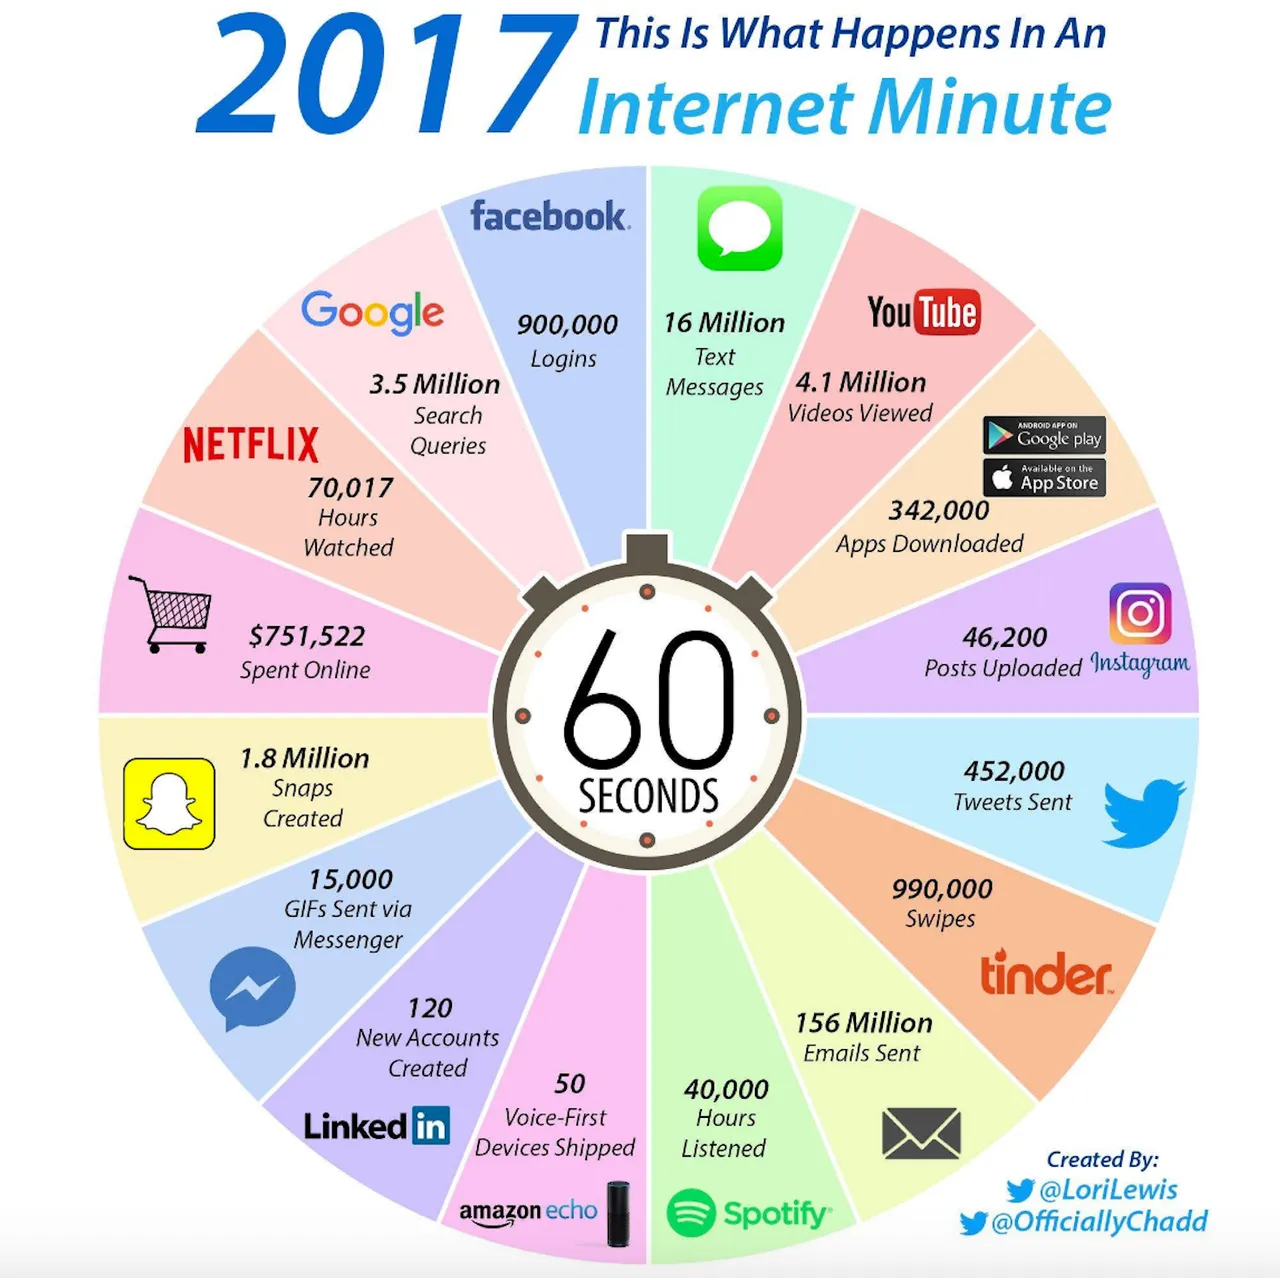
They created a infographic where you can see what happens every minute on the Internet this year 2017. Of course it is an approximate and surely has increased since they did it in August of this year. They used data from the most used social networks or services such as Facebook, YouTube, Instagram, Twitter, Tinder, Spotify, messaging services of different types, online purchases and even e-mails.
This is what happens every 60 seconds on the Internet.
Credit
60 seconds! Not a week or a day. So massive is the access to the Internet today.
I invite you to read the article that accompanies the infographic on the website of Visual Capitalist, it is an unmissable complement to the information that appears in the image.