
SUMMARY
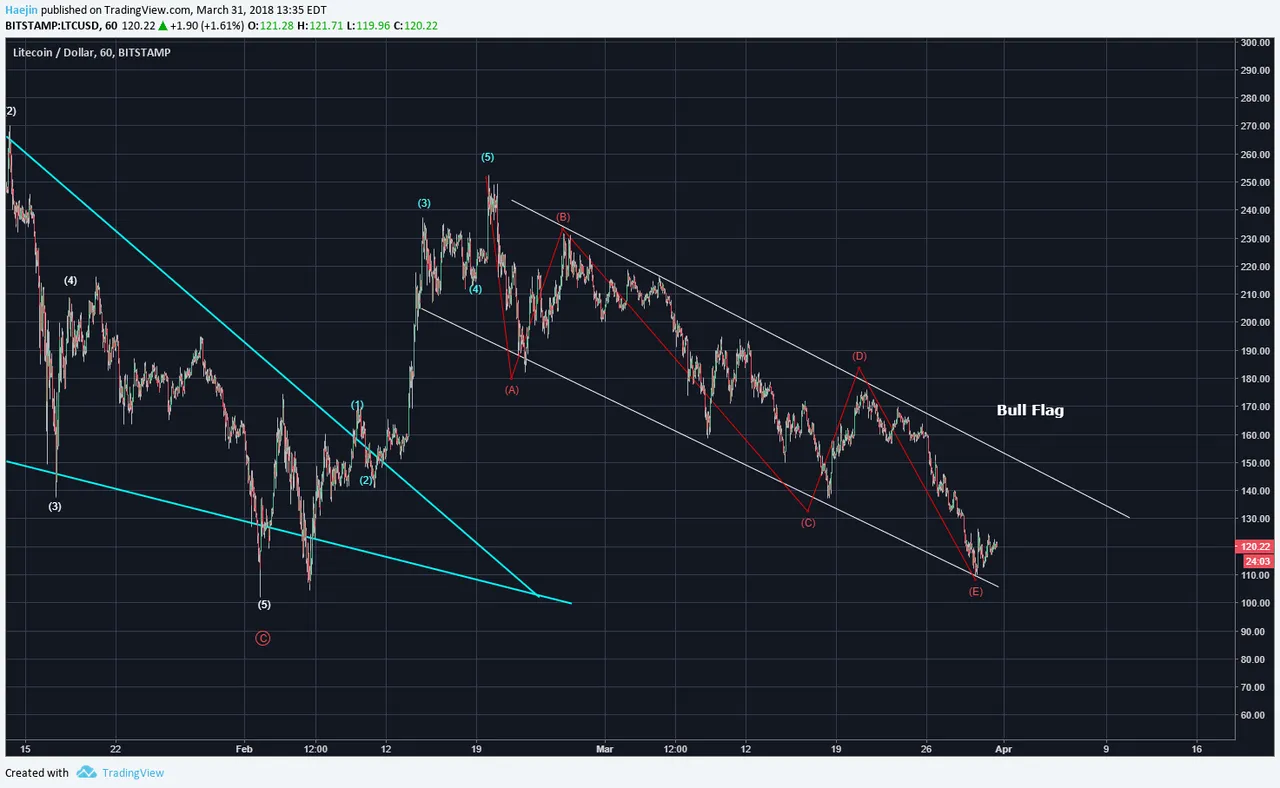
Litecoin (LTC) seems to have put in the abcde waves of a bull flag where price traverses within a downward pointing parallel lines. This has not generated a lower low compared to the start of the previous blue impulse wave up. It means that IF the E wave is complete, then a higher low could be placed and what would be needed next is a breakout of price from the flag pattern. This could take a few days.
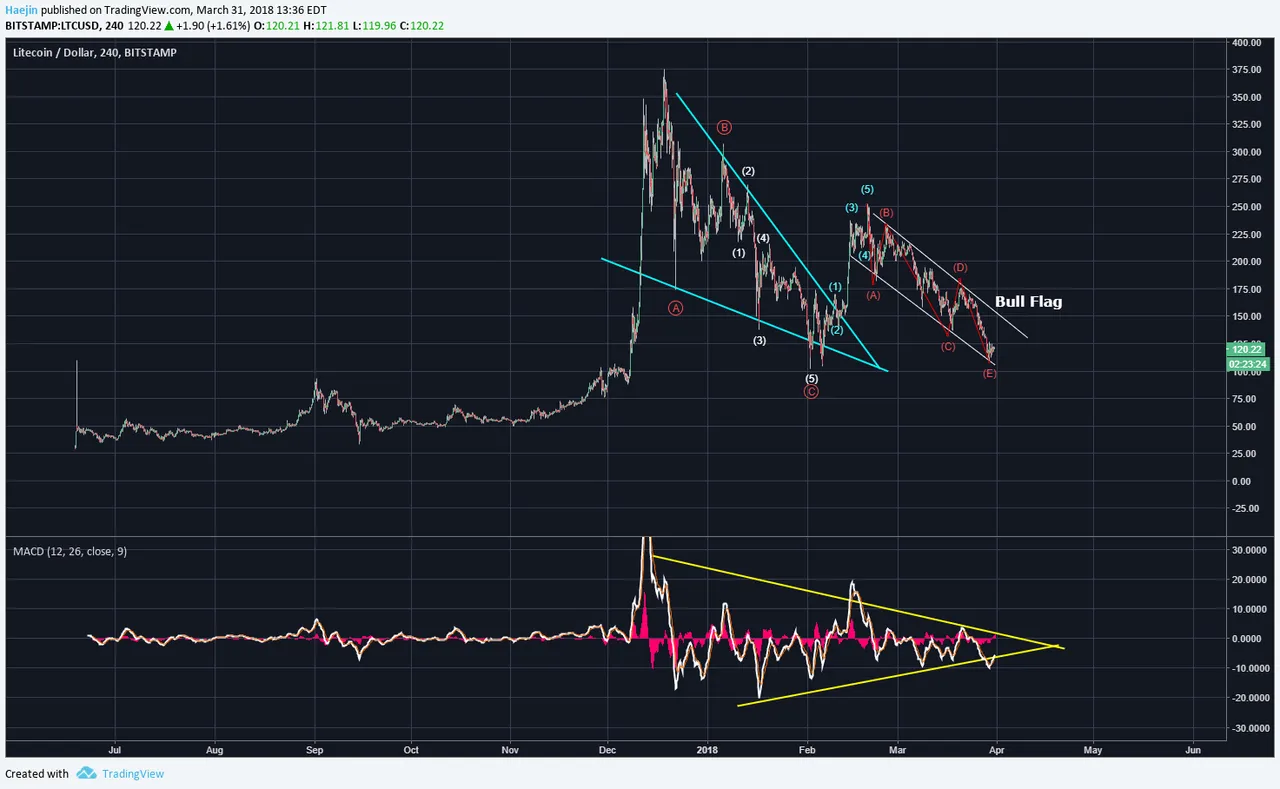
Check out the MACD! The commonality of sentiment is no accident! IF Litecoin (LTC) still has the baton and actually leads the breakout, it'll be a potential leading indicator; even to BTC! MACD is very proximal to the apex and could also set a bull wick given how it temporarily pierced the lower yellow support line.
Legal Disclaimer: I am not a financial advisor nor is any content in this article presented as financial advice. The information provided in this blog post and any other posts that I make and any accompanying material is for informational purposes only. It should not be considered financial or investment advice of any kind. One should consult with a financial or investment professional to determine what may be best for your individual needs. Plain English: This is only my opinion, make of it what you wish. What does this mean? It means it's not advice nor recommendation to either buy or sell anything! It's only meant for use as informative or entertainment purposes.
Please consider reviewing these Tutorials on:
Elliott Wave Counting Tutorial #1
Elliott Wave Counting Tutorial #2
Elliott Wave Counting Tutorial #3
Laddering and Buy/Sell Setups.
Laddering Example with EOS
Tutorial on the use of Fibonacci & Elliott Waves
@haejin's Trading Nuggets
Essay: Is Technical Analysis a Quantum Event?
Follow me on Twitter for Real Time Alerts!!
Follow me on StockTwits for UpDates!!
--
--

