SUMMARY
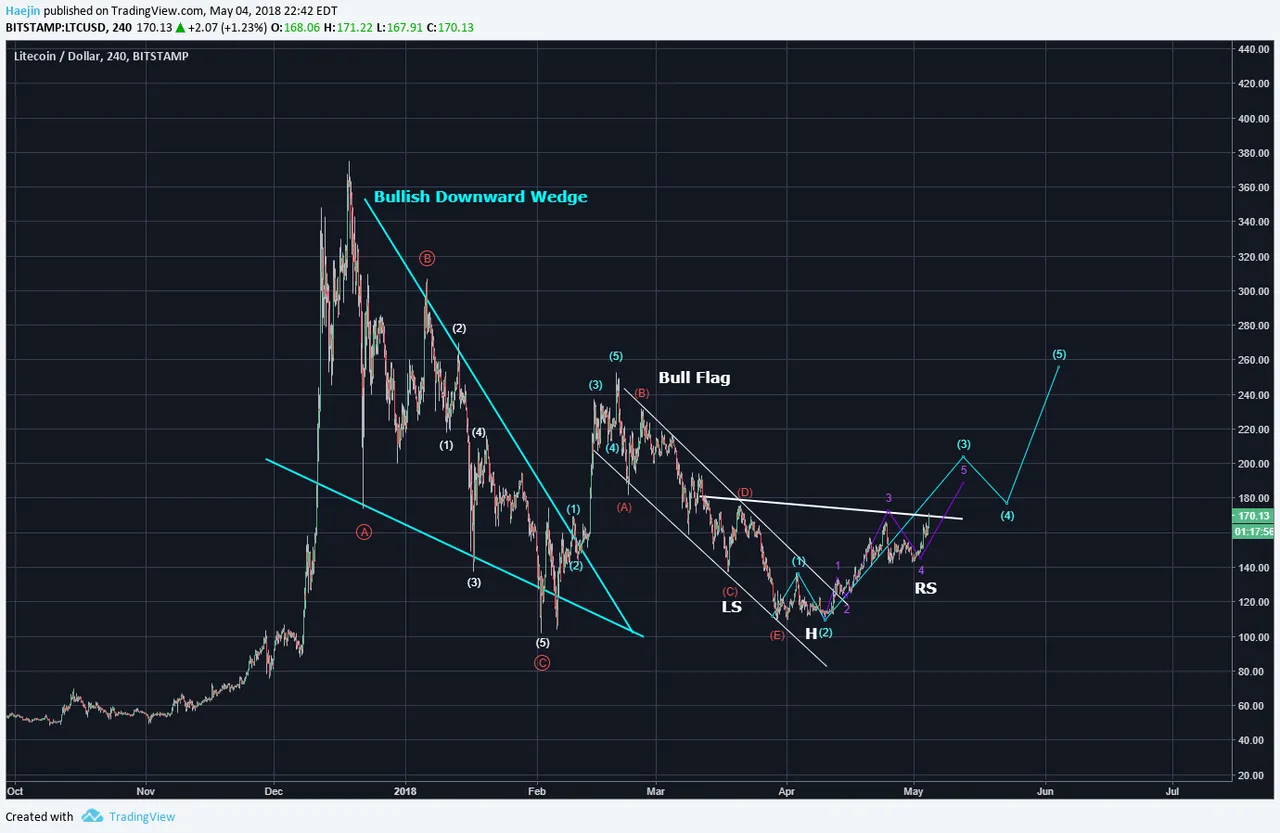
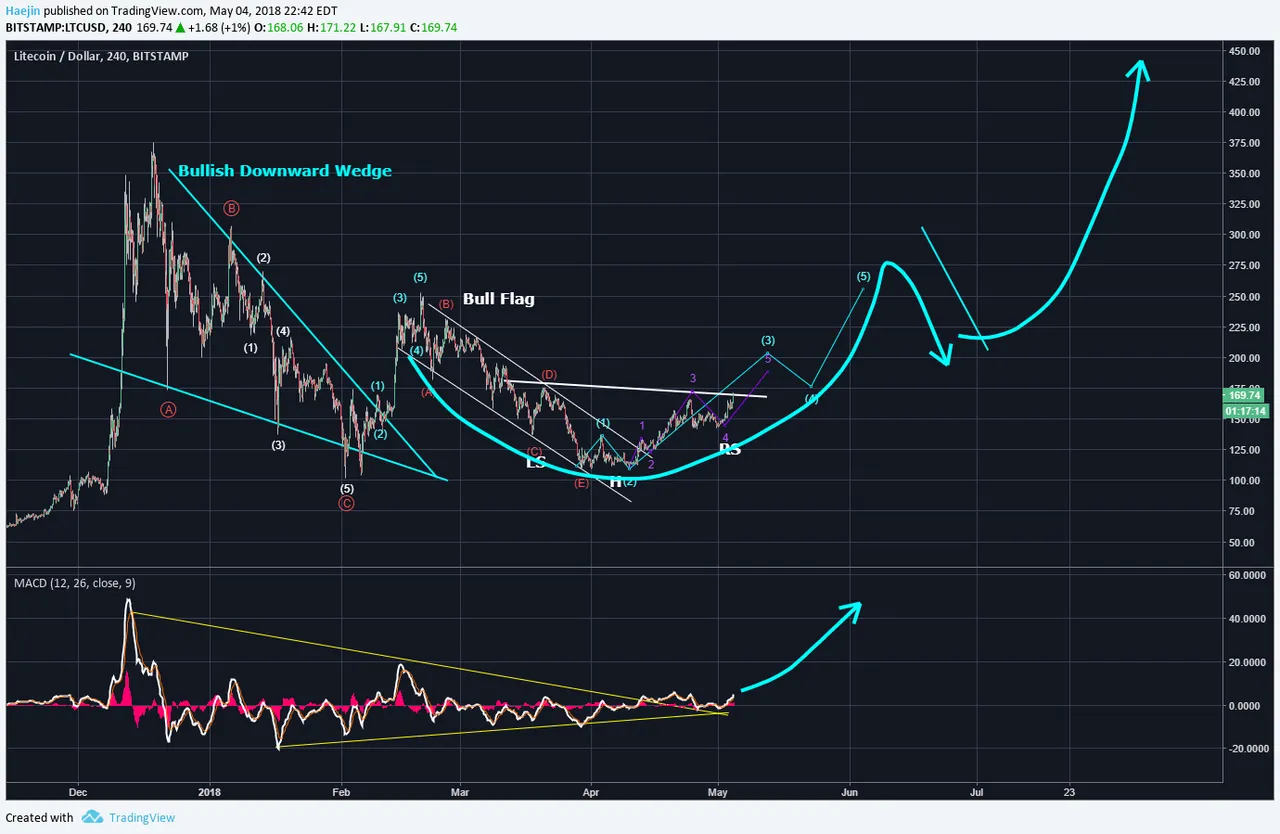
When you get with a bullish downward wedge and a bull flag combo? It's not a crash; but rather a phenomenal opportunity to potentially profit. Take a look at the below chart of Litecoin (LTC). It's primed and ready to deliver. The bull flag low generated a higher low; singaling the trend reversal at hand. Also, there is an Inverted H&S about to complete and confirm. The RS is almost done; so, perhaps the weekend will bring us a Neckline breach. The blue impulse waves project a potential price pathway and it represents just the start.

A bit messy with so many markings; but, it all makes sense and jives well with price, pattern, indicator and Elliott Waves. There is a real potential for a Cup & Handle pattern at around July or so; but that'll be a consolidation used to ready for the next run into November or late January of 2018. The PopCorn Symphony in C Major has started and by late Fall...amazing profits could be gotten by many.

Legal Disclaimer: I am not a financial advisor nor is any content in this article presented as financial advice. The information provided in this blog post and any other posts that I make and any accompanying material is for informational purposes only. It should not be considered financial or investment advice of any kind. One should consult with a financial or investment professional to determine what may be best for your individual needs. Plain English: This is only my opinion, make of it what you wish. What does this mean? It means it's not advice nor recommendation to either buy or sell anything! It's only meant for use as informative or entertainment purposes.
Please consider reviewing these Tutorials on:
Elliott Wave Counting Tutorial #1
Elliott Wave Counting Tutorial #2
Elliott Wave Counting Tutorial #3
Laddering and Buy/Sell Setups.
Laddering Example with EOS
Tutorial on the use of Fibonacci & Elliott Waves
@haejin's Trading Nuggets
Essay: Is Technical Analysis a Quantum Event?
Follow me on Twitter for Real Time Alerts!!
Follow me on StockTwits for UpDates!!
--
--

