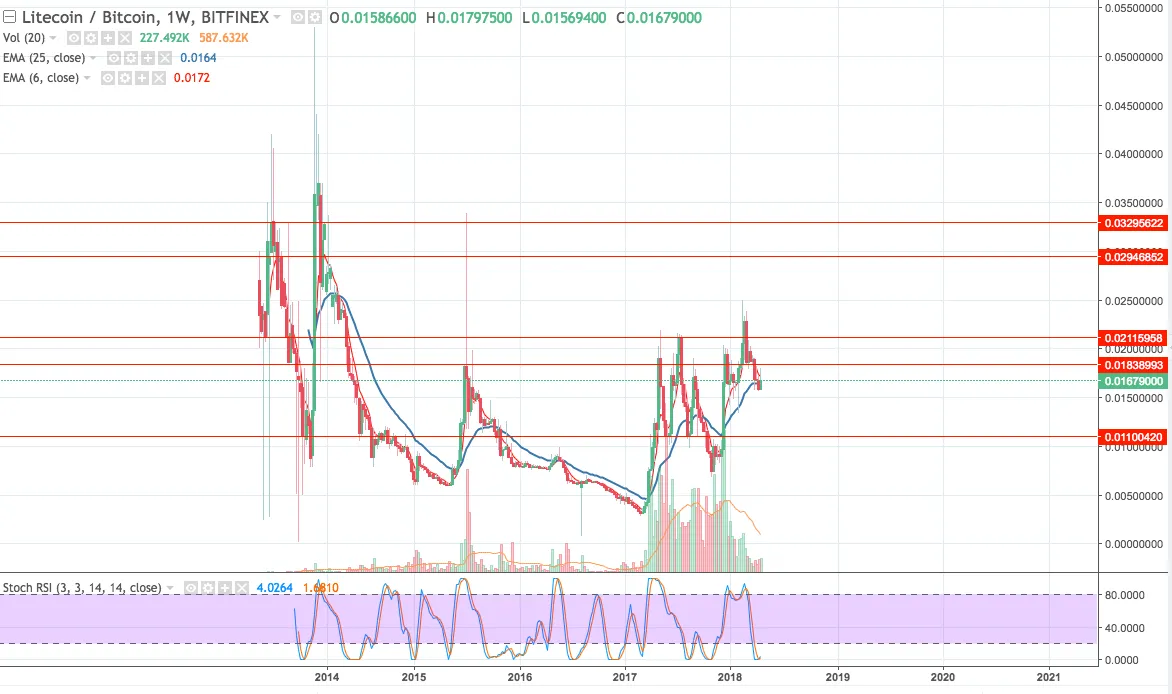
While Most of the High Market Cap Alts seems to have started a new bullish uptrend, LTC seems to be lagging! As a matter of fact it still seems like its in a downtrend! Here is what the Weekly and Daily Charts are telling us!
On the Weekly Chart: The Strong range between 0.02115 and 0.0110 still seems to be prominent! Stochastic indicator on the weekly is stil in the oversold zone with a flat angle indicating no signs of reversal yet! Add to that price is trading below fast moving average and seems to be taking a troll down to below the slow moving average to test the 0.0110 again!
On the Daily Chart: things aren't looking better either! As a matter of fact, Daily chart sort of confirms a downtrend for LTC. Despite the fact that there is a strong support at 0.01506 , stochastic indicator on the daily chart suggests that the price is overbought and is moving downward to the stochastic no-man's zone with a steep angle! If price didnt find strong support at 0.01506, it could just continue the weekly range referred to earlier!
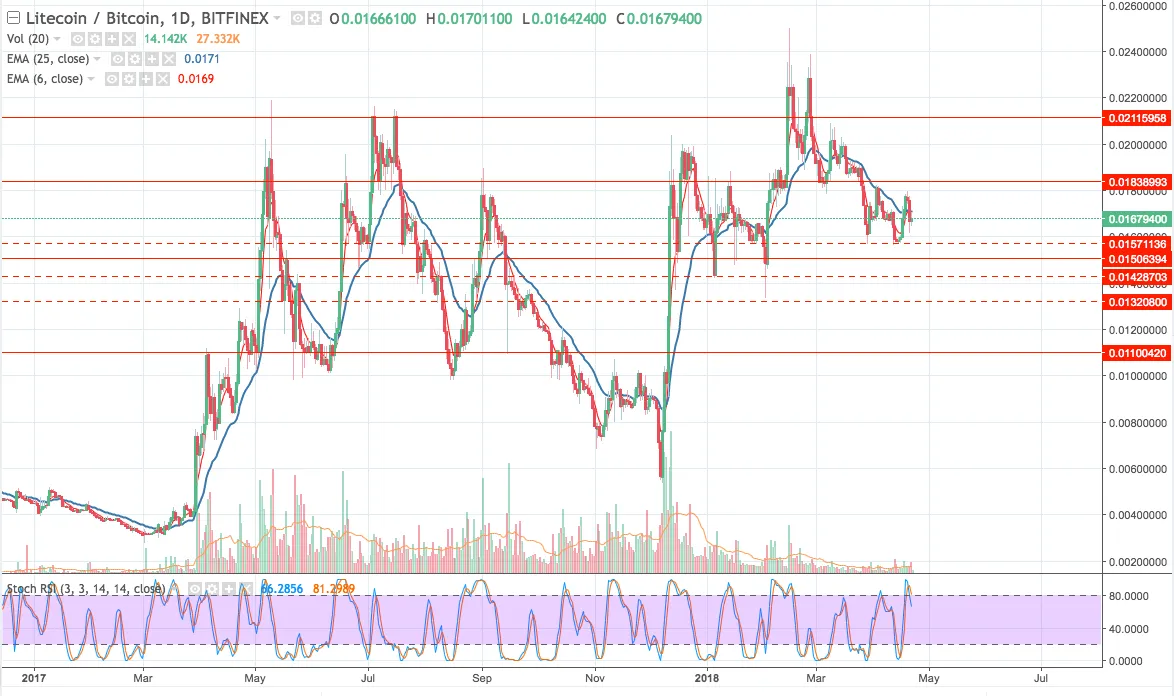
Personally, I would wait for a confirmed uptrend before going into LTC, but form what the charts are saying, its not happening anytime soon!