Mercury (MERBTC) has broken out of the triangle pattern in the four-hour chart.
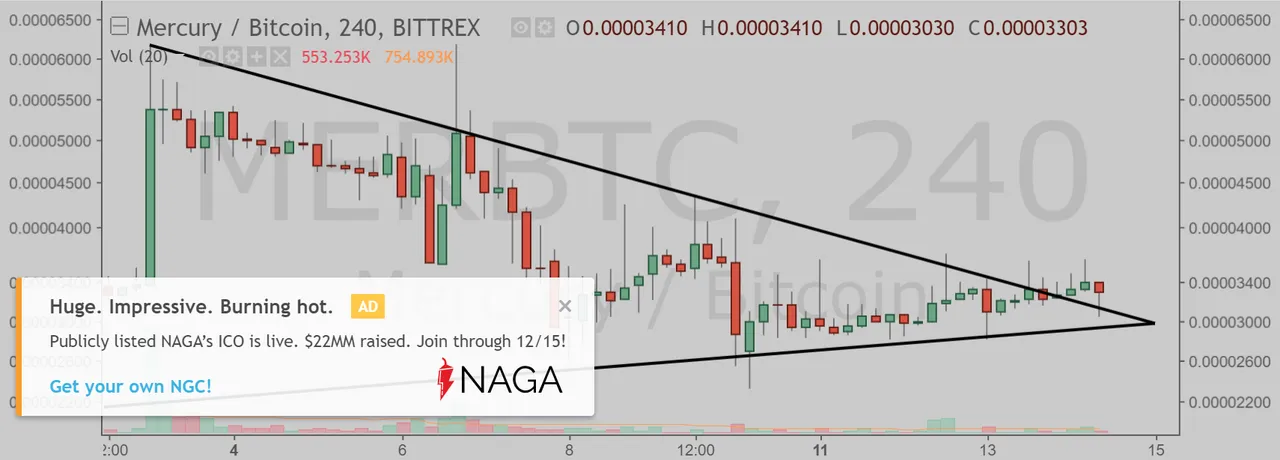
(Chart courtesy of Tradingview.com (log scale))
Elliott Wave Analysis
In Elliott Wave terms, Mercury began a wave one advance on November 18. The red wave one (blue sub-waves i-ii-iii-iv-v) advance finished on December 3, and the red wave two (blue sub-waves a-b-c) correction ended on December 10. If this wave count is correct, Mercury should be heading next towards the December 3 peak in the red wave three.
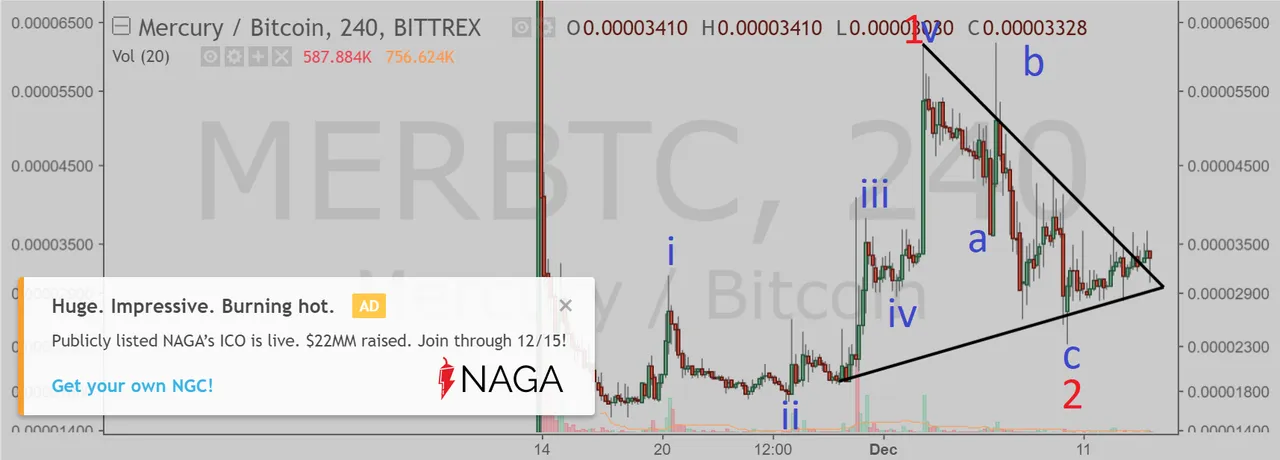
(Chart courtesy of Tradingview.com (log scale))
One can see the sub-waves even better in the line chart without any overlapping.
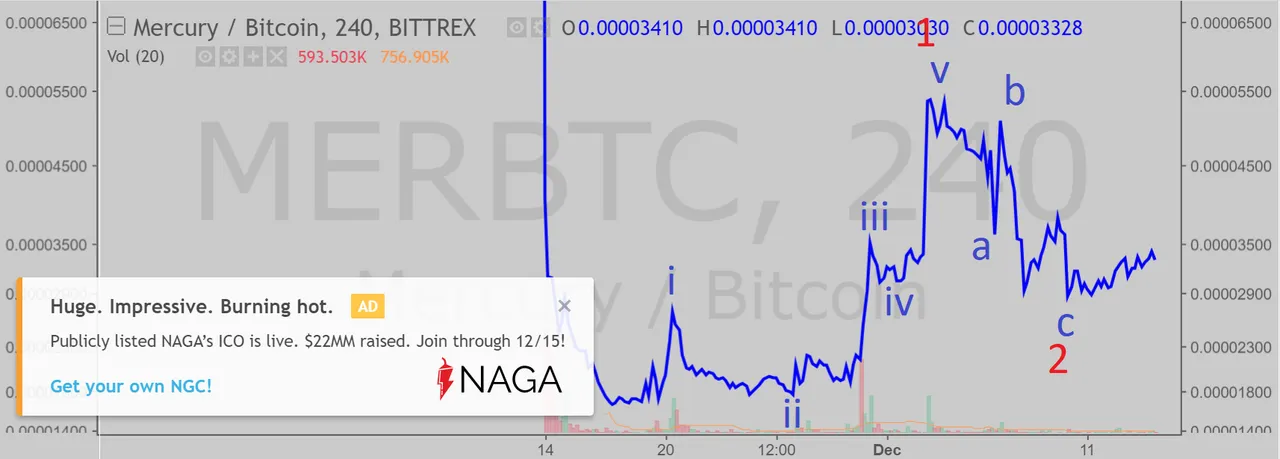
(Chart courtesy of Tradingview.com (log scale))
Funnymentals
According to the team:
Mercury is a public token used as fuel to link the private Jupiter blockchain to the public Waves blockchain.
(Source: https://www.darcr.us/products/mercury/)

If you think this analysis is correct, upvote this post and upvote the comment "Mercury will takeout the December 3 peak".
If you think this analysis is wrong, upvote this post and upvote the comment "Mercury will drop below the November 18 low".
If you think Mercury is in a range, upvote this post and upvote the comment "Mercury will stay in a trading range between the November 18 low and the December 3 peak until January 14, 2018".
You can upvote the comment until 3 PM EST December 15 and you can upvote only one comment. 50% of SBD from this post will be distributed equally to the winners. The winners will be determined by the price action (which one happens first).