MonetaryUnit (MUEUSD) has broken out of the triangle pattern in the four-hour chart.
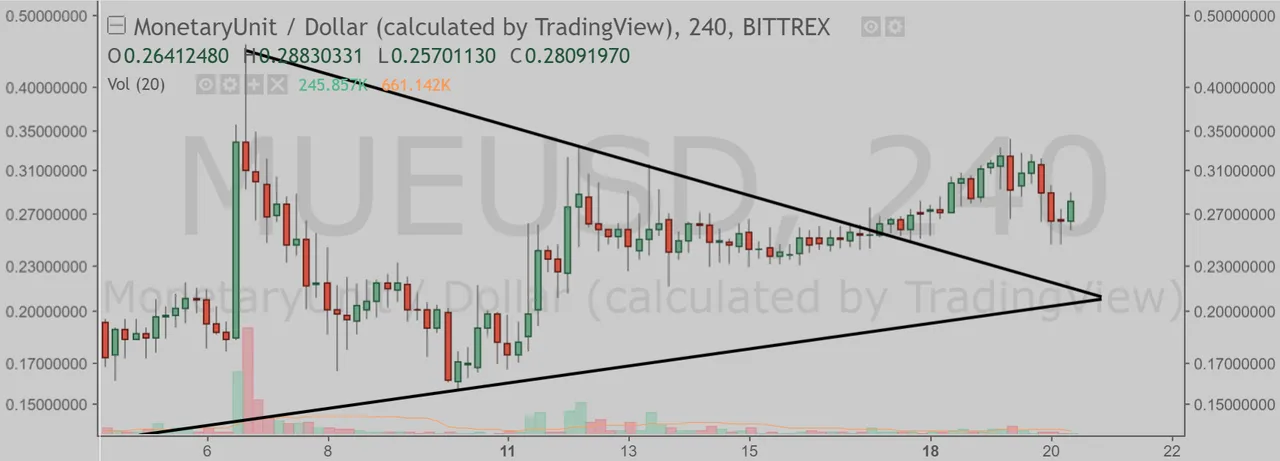
(Chart courtesy of Tradingview.com (log scale))
Elliott Wave Analysis
In Elliott Wave terms, MonetaryUnit began a wave one advance on November 12. The red wave one (blue sub-waves i-ii-iii-iv-v) advance finished on December 6, and the red wave two (blue sub-waves a-b-c) correction ended on December 10. If this wave count is correct, MonetaryUnit should be heading next towards the December 6 peak in the red wave three.
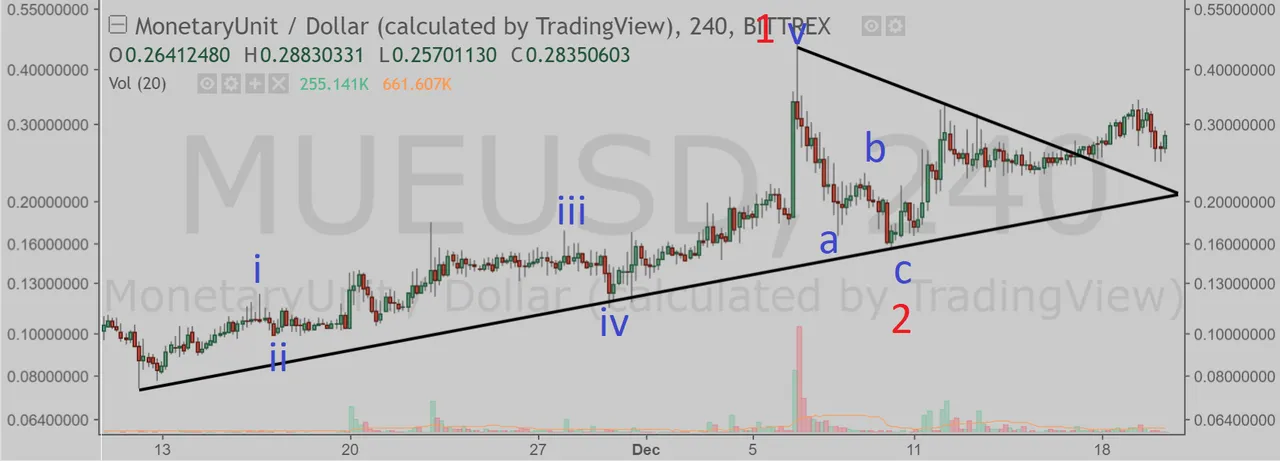
(Chart courtesy of Tradingview.com (log scale))
Looking at the weekly chart, I believe MonetaryUnit is currently in the red wave five (blue sub-wave iii).
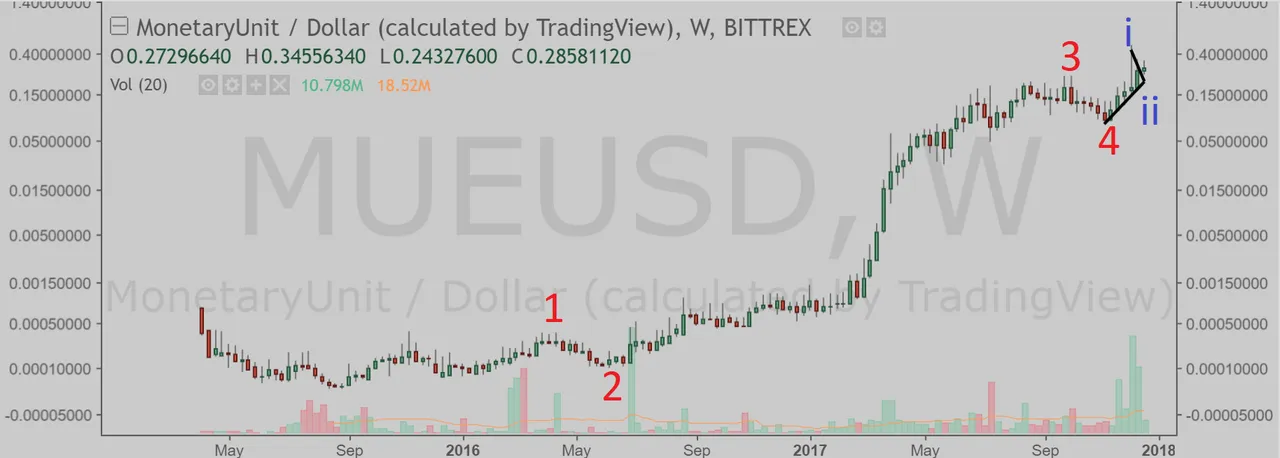
(Chart courtesy of Tradingview.com (log scale))
Funnymentals
MonetaryUnit provides secure, fast, anonymous, instant transactions. Here is the official video.
(Source: https://www.monetaryunit.org/)

If you think this analysis is correct, upvote this post and upvote the comment "MonetaryUnit will takeout the December 6 peak".
If you think this analysis is wrong, upvote this post and upvote the comment "MonetaryUnit will drop below the November 12 low".
If you think MonetaryUnit is in a range, upvote this post and upvote the comment "MonetaryUnit will stay in a trading range between the November 12 low and the December 6 peak until January 20, 2018".
You can upvote the comment until 3 PM EST December 21 and you can upvote only one comment. 50% of SBD from this post will be distributed equally to the winners. The winners will be determined by the price action (which one happens first).