Bolsa de valores de NewYork (New York Stock Exchange)
Anlisis tecnico SPY - (Technical analysis SPY)
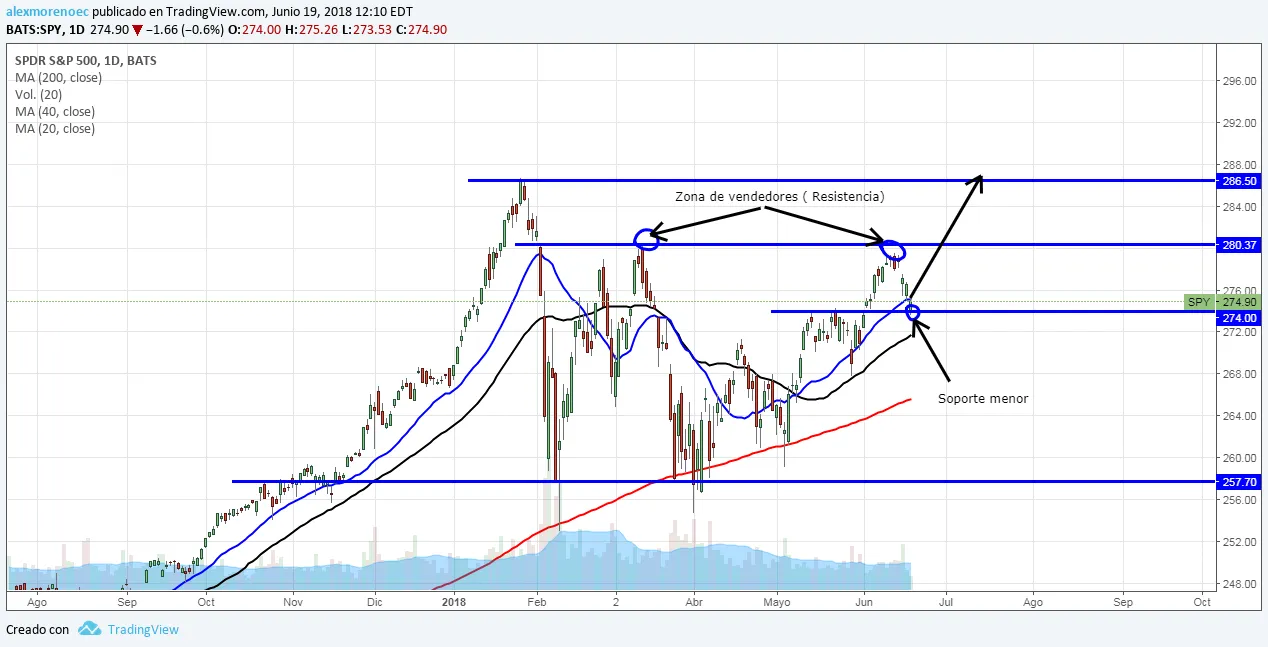
Grafico Diairo - (Daily chart).-
In Spanish:
El grafico diario del SPY nos esta dando una señal poderoza, esta rebotando los precios sobre soporte menor , tenemos las ma20 y ma40, ma 200 por debajo de los precio, es la configuracion perfecta para una entrada en largo., el objetivo de esta transaccion la podemos repartir en 2 partes, primero deberiamos llegar a la zona de $280 y tener una especie de toma de ganancias de parte de los compradore , para luego confirmando que se de un rebote de precios en esa misma zona, continuar su escalada alcista hasta llegar a maximo historios en zona de $286.
In Inglish:
The graph in daily temporality of the ETF SPY, is giving us a powerful signal, is bouncing prices on lower support, we have the ma20 and ma40, ma200 below the price, it is the perfect configuration for a long entry., The objective of this transaction we can divide it into 2 parts, first we should reach the area of $ 280 and have a kind of profit taking by the buyers, and then confirm that there is a price rebound in that same area, continue its escalation bullish until reaching historic highs in area of $ 286.


by alexmorenoec