In this very informative video Mike Maloney discusses a yield curve tool with Jeff Clark, senior precious metals analyst, that dynamically shows the U.S. Treasury bonds' yield curve over time. Mike and Jeff also talk about the importance of the yield curve in predicting a stock market correction.

Image from GoldSilver (w/Mike Maloney)
Topics
Dynamic Treasury Yield Curve Tool

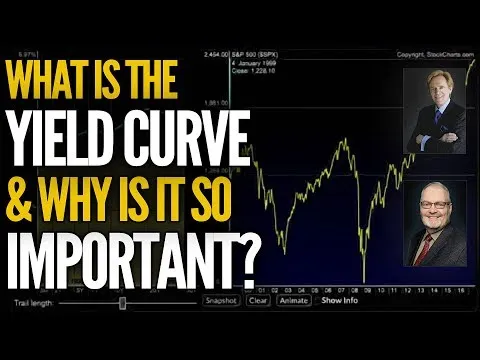
Snapshot from the video
Mike explains how the yield curve changes at different times versus the S&P500. Mike demonstrates a positive yield curve, a flat yield curve, and a negative (inverted) yield curve. Mike explains the significance of a flat and inverted yield curves in predicting stock market actions.
Full Video
6 minute video from GoldSilver (w/Mike Maloney) published 18 July 2017
I am not affiliated with Mike Maloney. I am a subscriber to the GoldSilver (w/Mike Maloney) YouTube channel.
The purpose of this post is to expose Mike Maloney's work to a wider audience, increase his views on YouTube, and hopefully increase the number of subscribers to his YouTube channel.