I have not been writing about SILVER for quite some time now, because after it got dumped again to 14.3 $ it took a loooong time to recover. Now SILVER has managed to break out of the downtrend and opened possibilites for a new rally.
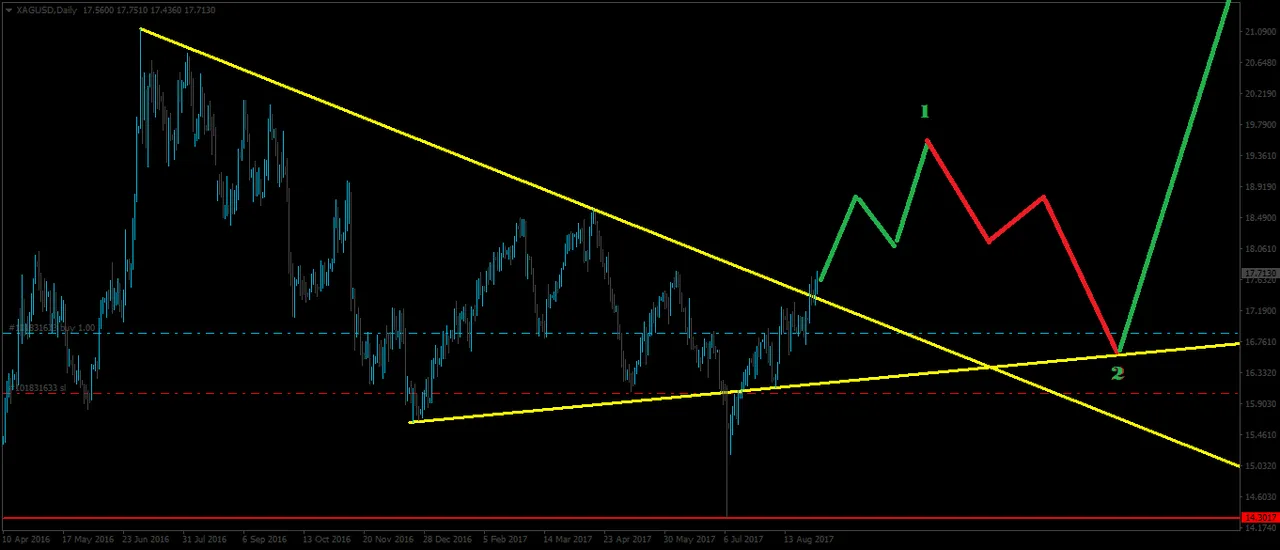
This is the Daily chart of SILVER showing how this break out could play out according to elliott wave rules.
Now let's have a closer look at this breakout:
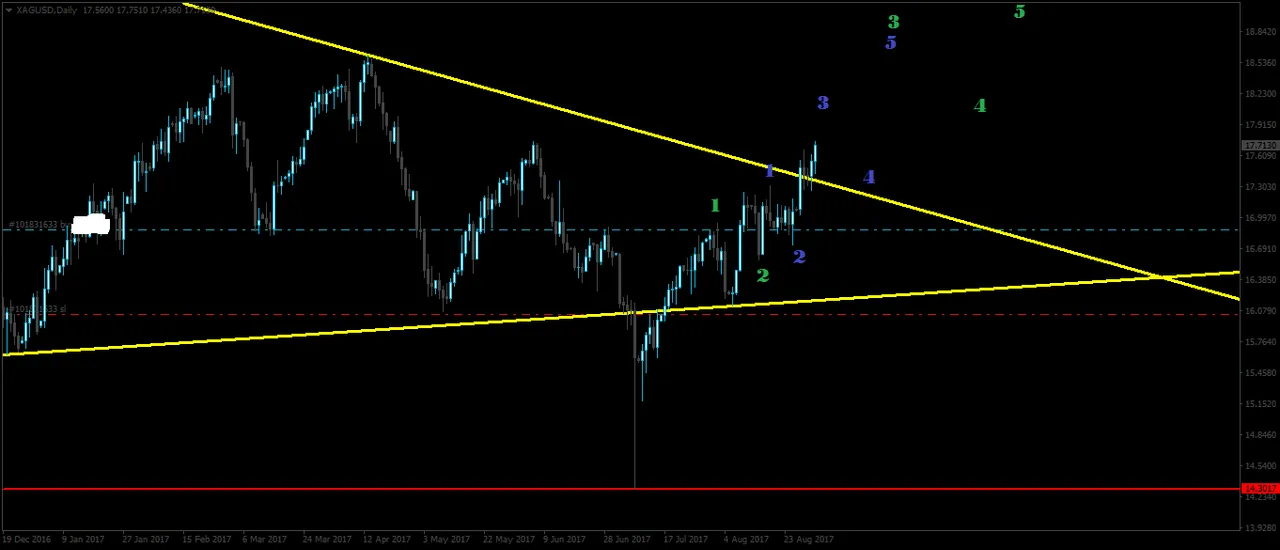
If the blue wave 4 is going to touch the yellow trendline from above, this would be the perfect breakout/backtest scenario, which is an over 80% bullish scenario. If this happens i will take a risk of 5% of my portfolio. I would love to see this happening...
Stay tuned... I will surely update SILVER every week now....

If you think this to be useful information:

DISCLAIMER: I provide trading ideas using EW and Pattern analysis. The material in this post does not constitute any trading advice whatsoever. This is just the way i see the charts and what my trading ideas are. The author of this post is holding positions in this market at the time of this post.
If you make any trades after reading this post it is completely in your responsibility. I am not responsible for any of your losses. By reading this post you acknowledge and accept that.
Tell me what you think...
Have a nice day :-)