
SUMMARY
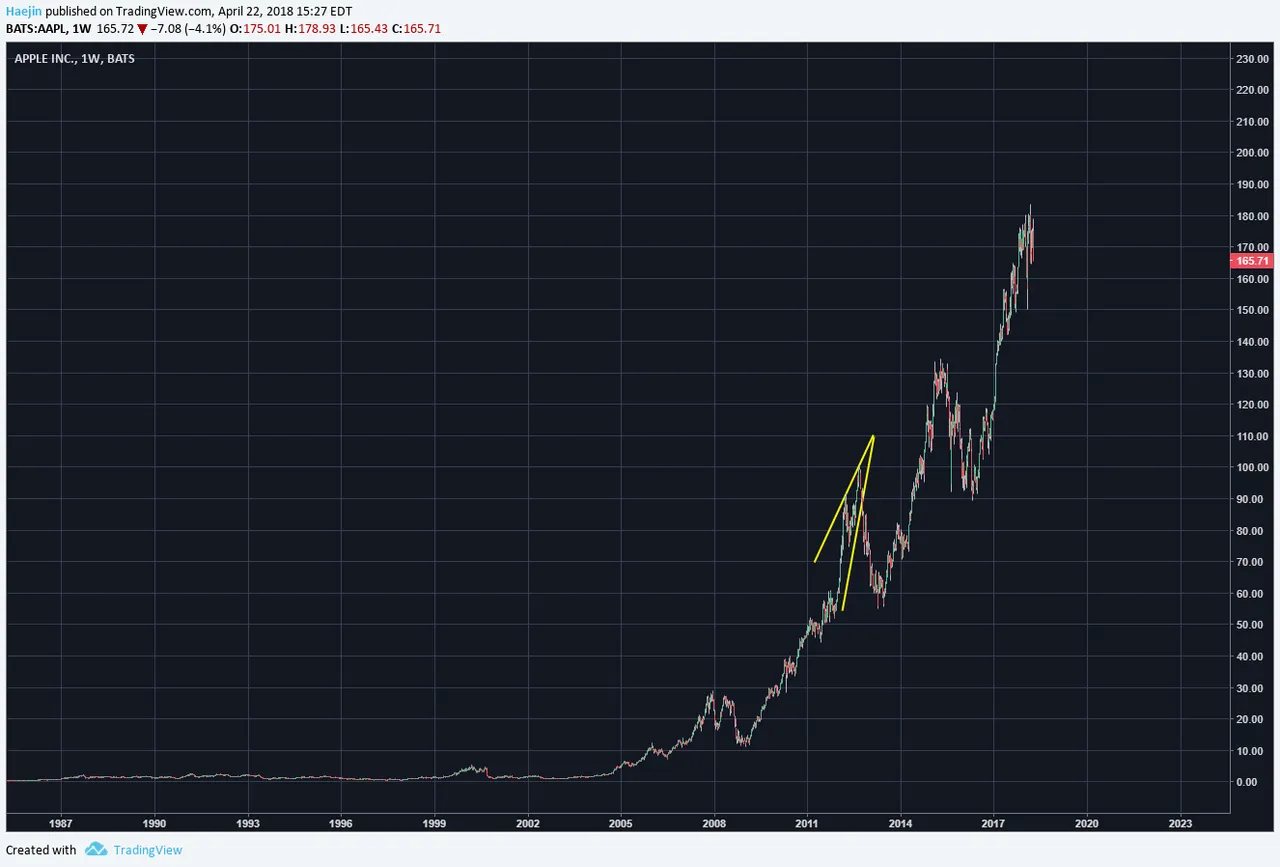
Here is APPLE (AAPL) weekly charts displaying a series of piercing, upward wedge fractals. The below is the first in yellow. Price got close to the apex and then collapsed to near the starting point of the wedge pattern.
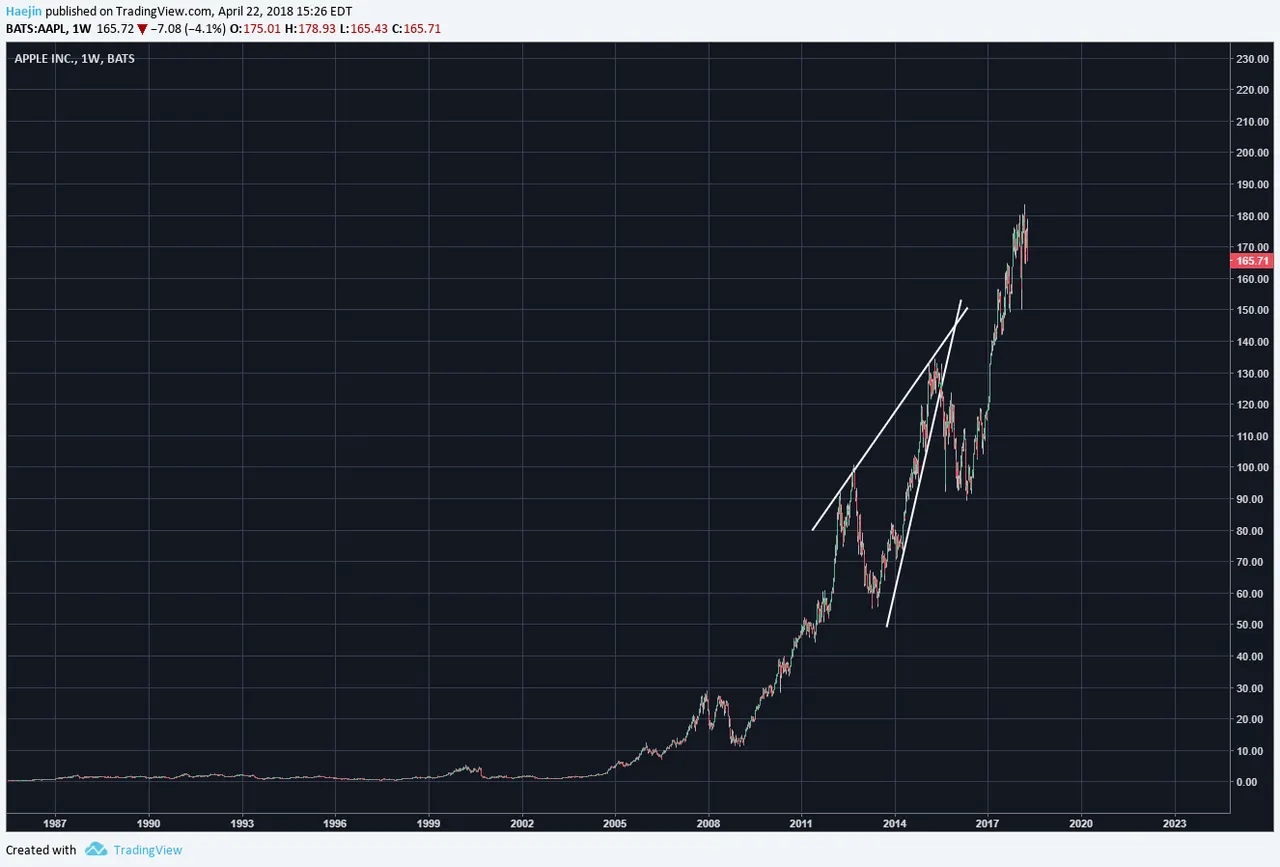
Here is the second, but larger fractal (white). Price again closely approached the wedge and then breached the lower trend line to overlap the peak of the first wedge.
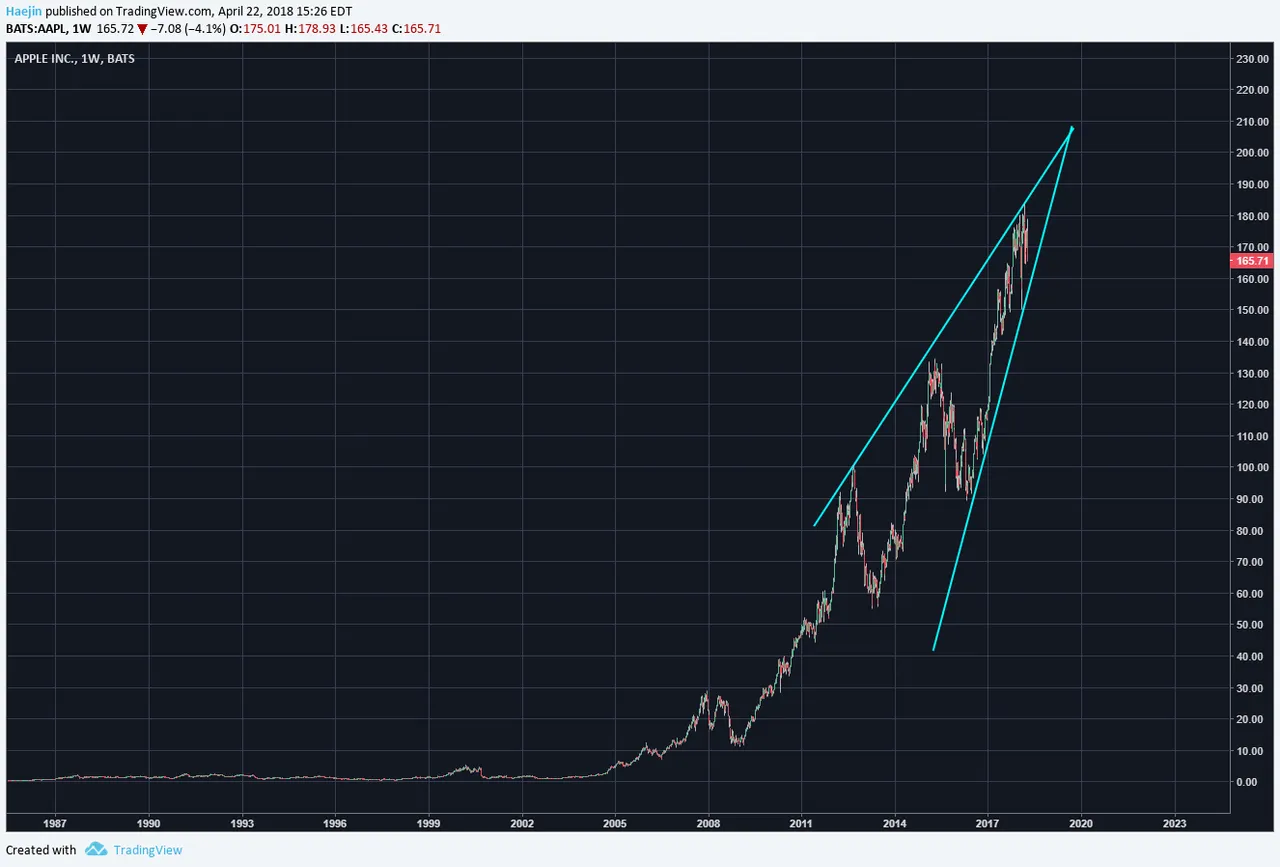
Putting it all together, the blue upward wedge is sizable, uncanny and not to ignore easily. Does this look like the best time to be buying AAPL? How much more upside might there be left?
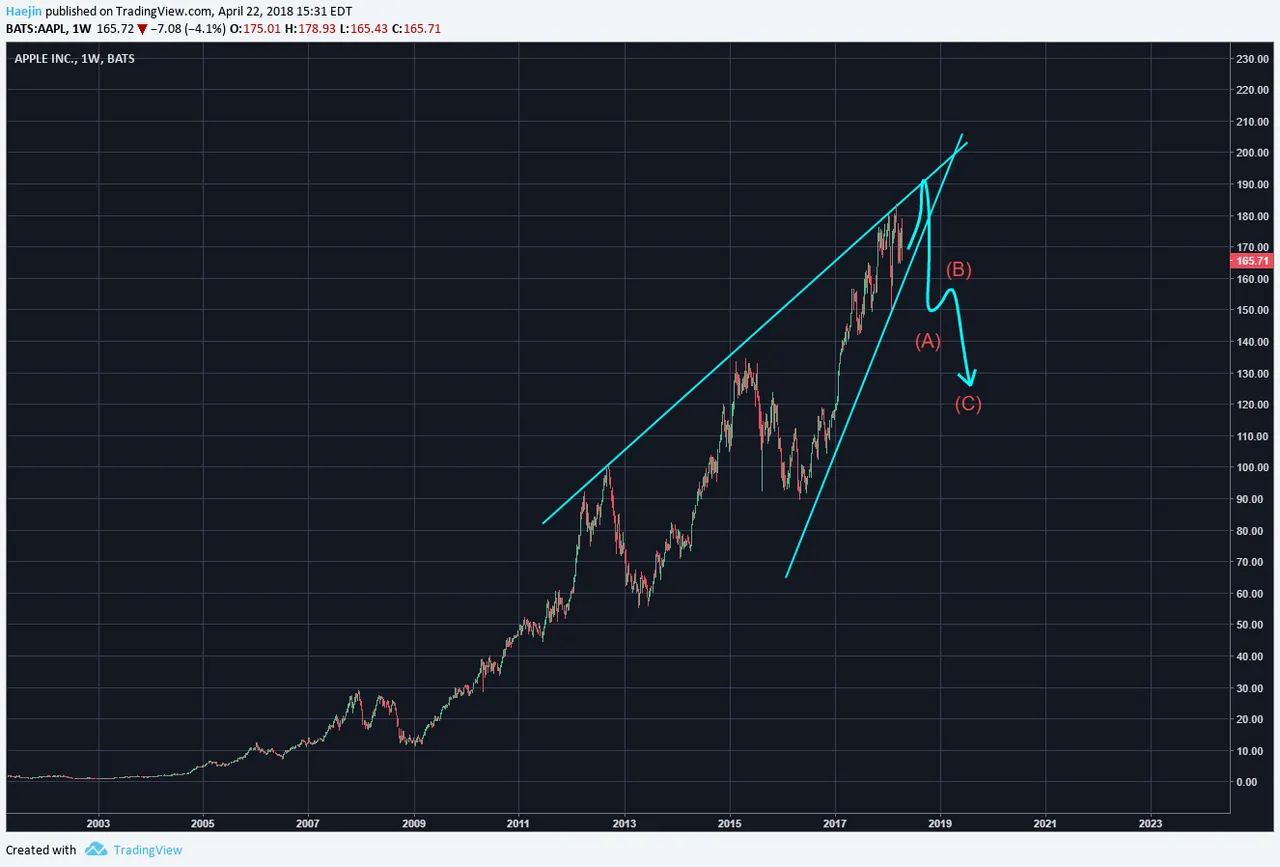
AAPL could hit $190 prior to succumbing to the pull down from the contracting lines. The ABC decline is expected to be swift and scary and will likey overlap with the peak of the second wedge pattern. For HOLDERs, this is a healthy correction. For Traders...I hope this post can help augment your own due diligence.
Legal Disclaimer: I am not a financial advisor nor is any content in this article presented as financial advice. The information provided in this blog post and any other posts that I make and any accompanying material is for informational purposes only. It should not be considered financial or investment advice of any kind. One should consult with a financial or investment professional to determine what may be best for your individual needs. Plain English: This is only my opinion, make of it what you wish. What does this mean? It means it's not advice nor recommendation to either buy or sell anything! It's only meant for use as informative or entertainment purposes.
Please consider reviewing these Tutorials on:
Elliott Wave Counting Tutorial #1
Elliott Wave Counting Tutorial #2
Elliott Wave Counting Tutorial #3
Laddering and Buy/Sell Setups.
Laddering Example with EOS
Tutorial on the use of Fibonacci & Elliott Waves
@haejin's Trading Nuggets
Essay: Is Technical Analysis a Quantum Event?
Follow me on Twitter for Real Time Alerts!!
Follow me on StockTwits for UpDates!!
--
--

