
SUMMARY
Note: For anyone who missed the BitcoinLive Information Webinar, here is the replay link: 
As of June 4th, ALL Crypto Analysis will be posted on the BitcoinLive channel and Steemit will be dedicated for Equity, Commodity and Options Analysis. To Signup for the BitcoinLive limited Founding Membership slots, use this link: https://get.bitcoin.live/haejin/
__
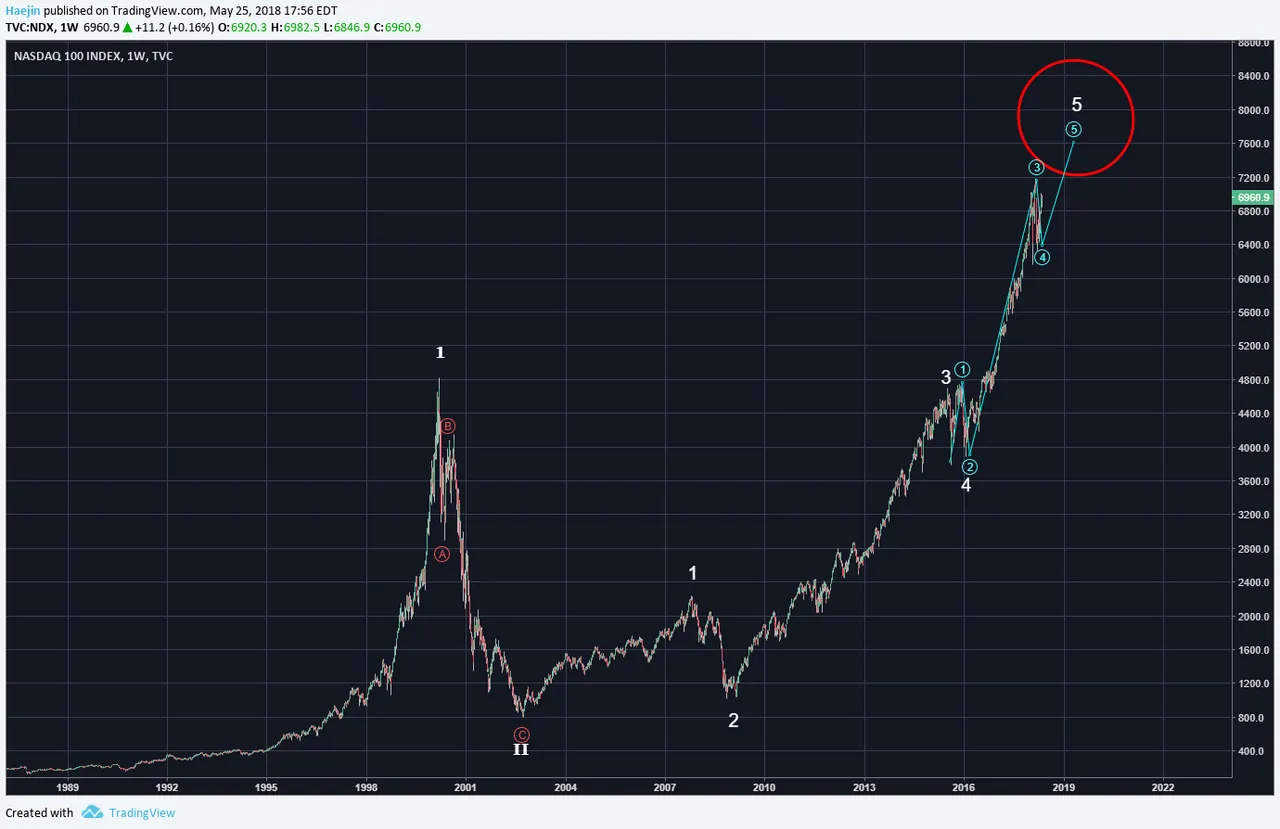
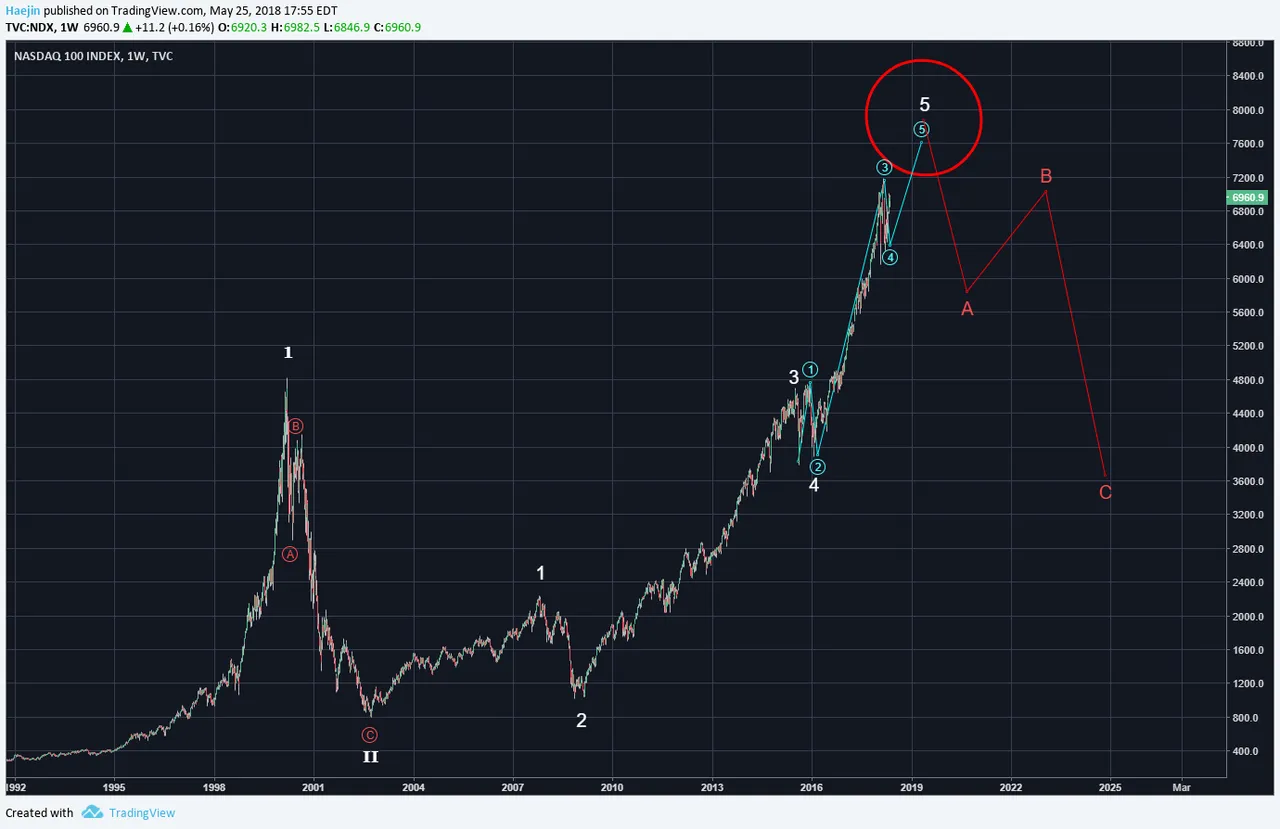
The more charts I analyze on the equity side, the more I'm seeing signs of a potential intermediate topping. I've shown this with FedEx, UPS and other charts stating that a minor recessionary pressure might be arriving. The below chart of the Nasdaq 100 Index (NDX) is showing that five waves are likely nearing completion; if not already! The red circle designates some more upward mobility but very limited. This shows that the technology sector could be readying for a potential correction that translates into a recession.
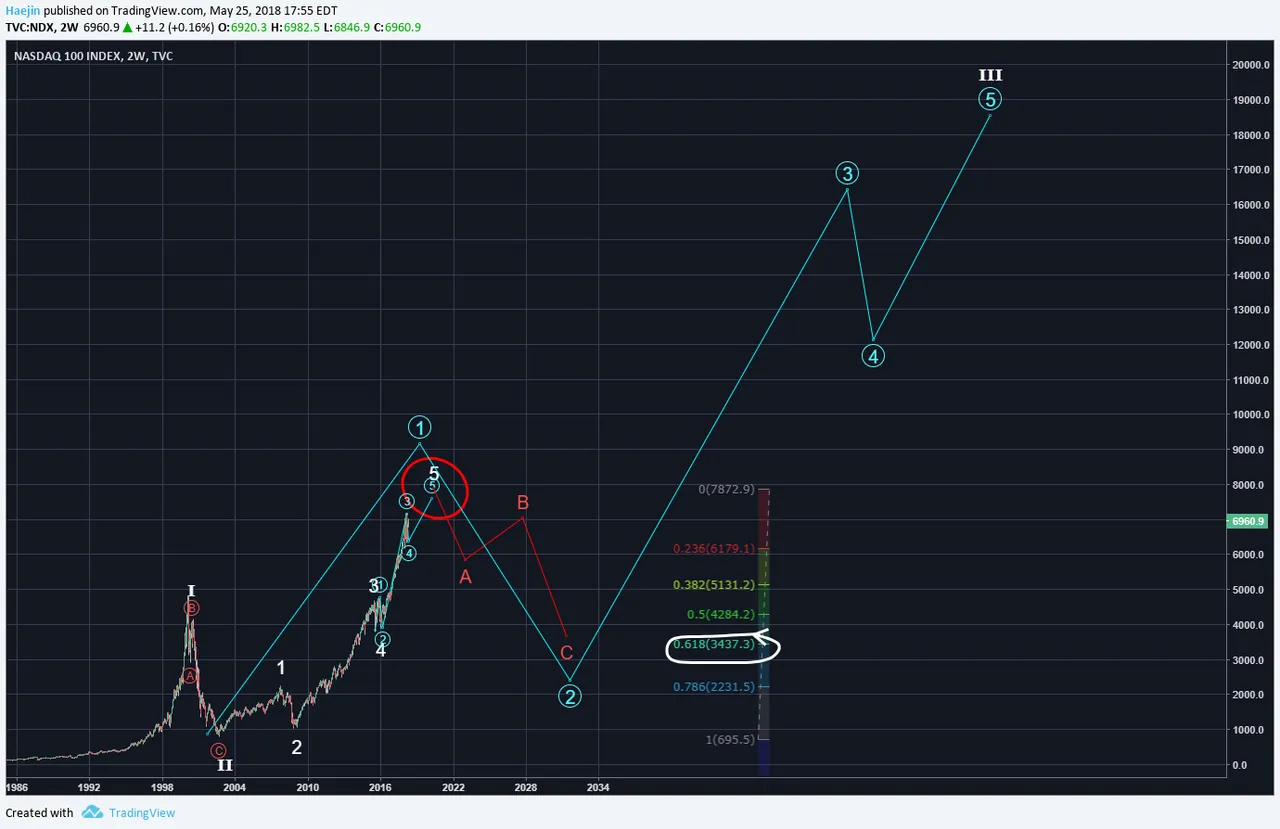
The ABC correction will likely retrace to the prior white wave 4 or so and that'll probably mark the 0.618 Fib level, as shown in the below chart. The subwaves of whtie wave 5 show that blue 5 could be remaining.
From a cycle degree of trend; white wave I and II are complete and III is in progress. Blue wave 1 of III is nearing completion and blue wave 2 of III is the correction to be expected soon.
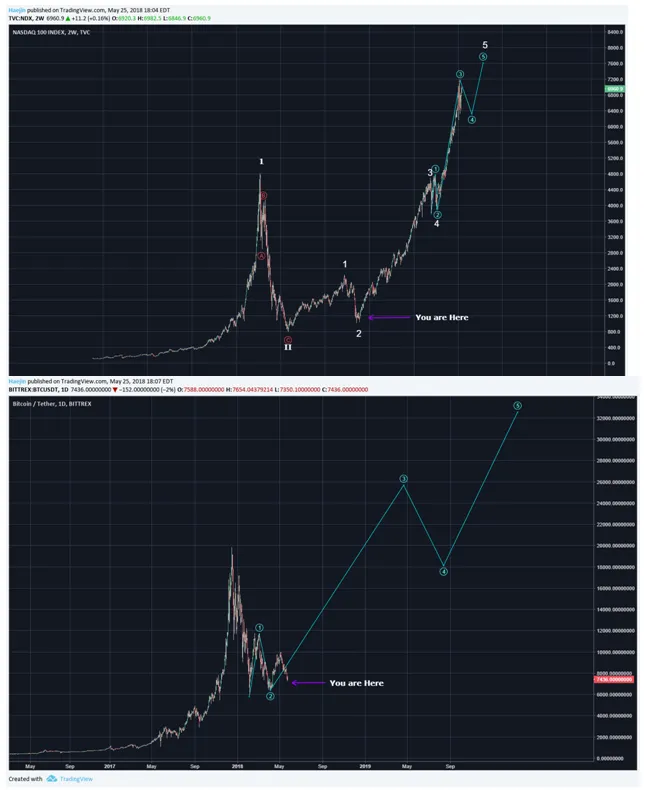
Here is an interesting comparison of NDX to the Bitcoin (BTC) charts. I believe Bitcoin is reflective of NDX back in 2008 or so before making is meteoric rise to current levels. Bitcoin could also follow a similar fractal pathway!
Legal Disclaimer: I am not a financial advisor nor is any content in this article presented as financial advice. The information provided in this blog post and any other posts that I make and any accompanying material is for informational purposes only. It should not be considered financial or investment advice of any kind. One should consult with a financial or investment professional to determine what may be best for your individual needs. Plain English: This is only my opinion, make of it what you wish. What does this mean? It means it's not advice nor recommendation to either buy or sell anything! It's only meant for use as informative or entertainment purposes.
Please consider reviewing these Tutorials on:
Elliott Wave Counting Tutorial #1
Elliott Wave Counting Tutorial #2
Elliott Wave Counting Tutorial #3
Laddering and Buy/Sell Setups.
Laddering Example with EOS
Tutorial on the use of Fibonacci & Elliott Waves
@haejin's Trading Nuggets
Essay: Is Technical Analysis a Quantum Event?
Follow me on Twitter for Real Time Alerts!!
Follow me on StockTwits for UpDates!!
--
--

