
SUMMARY
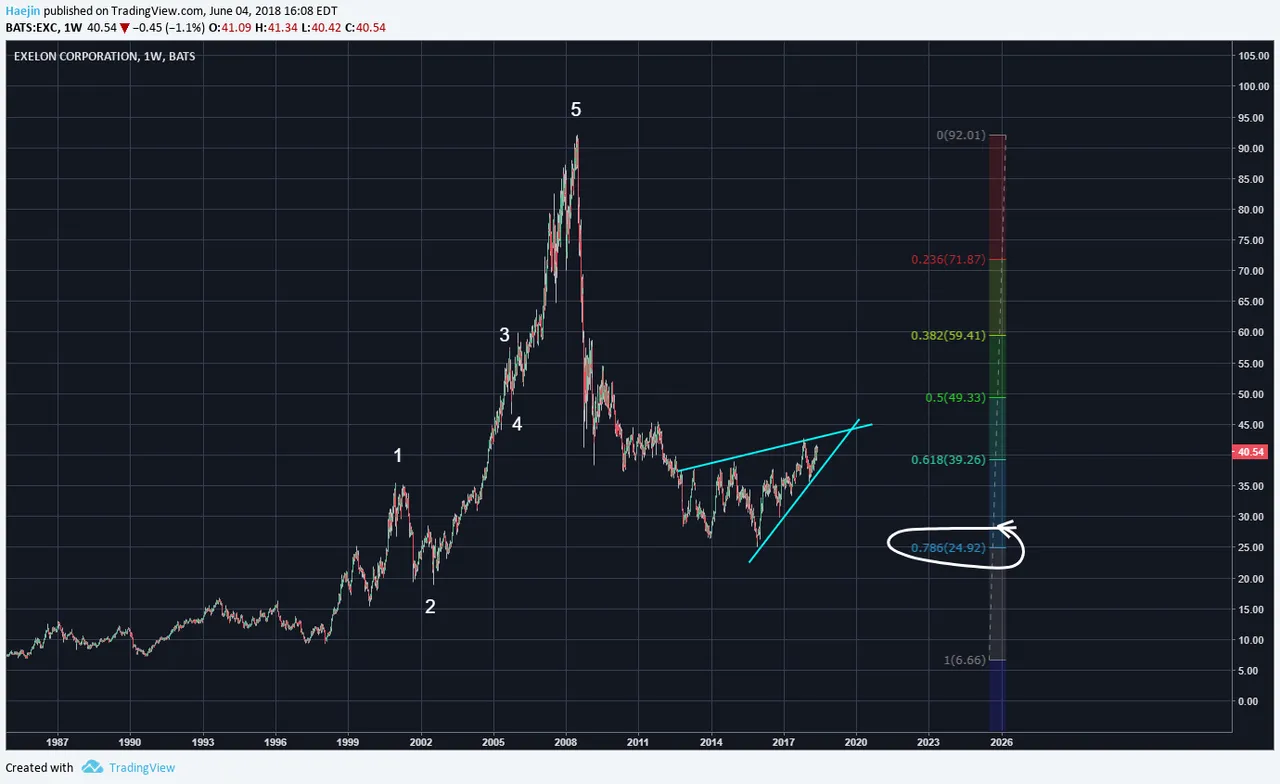
Excelon Corp. (EXC) has been correcting since 2008 and hasn't really recovered much at all! The chart below shows that the retracement was 0.78 Fibl level and the initial crash was horrific, to say the least. Do you see a certain trait that goes with such deep retracements?
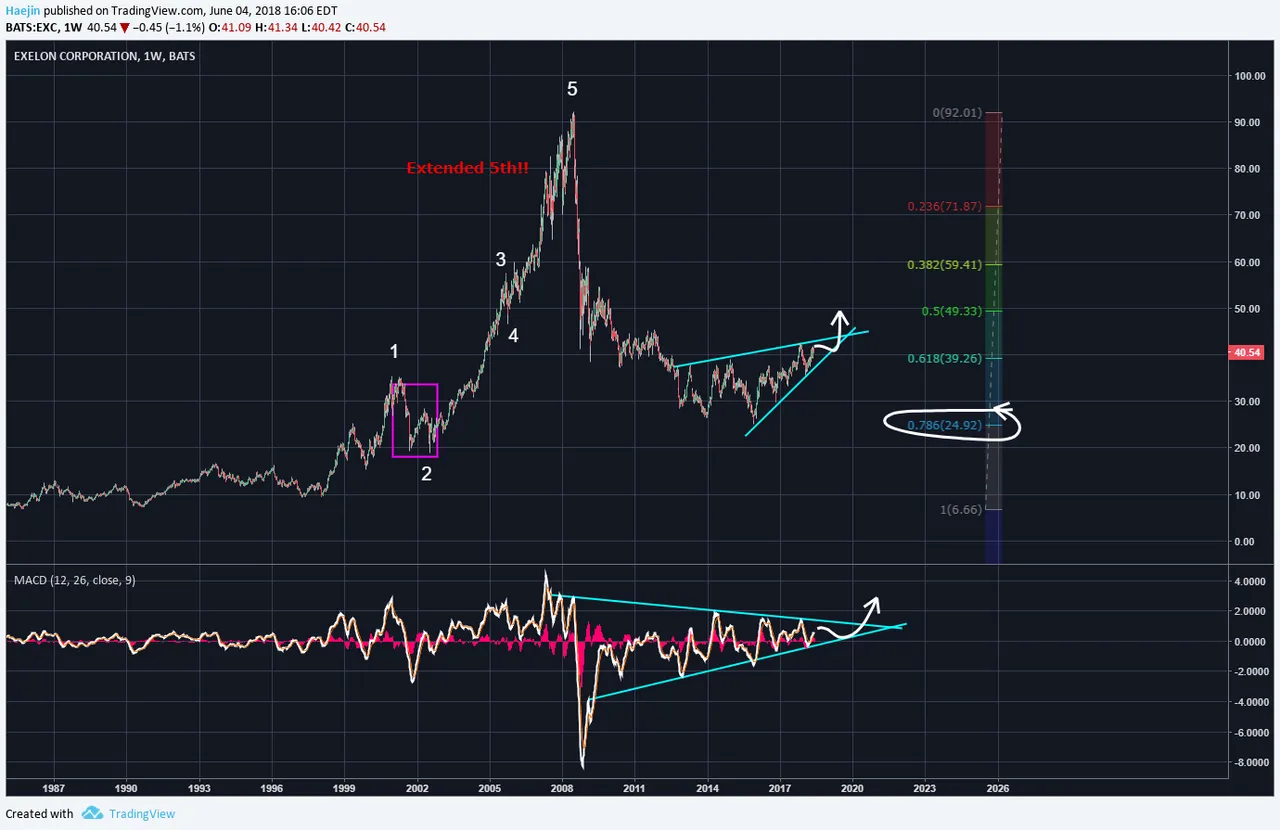
Look how extended the white 5th wave was! This is why price has retraced towards the prior wave 2 zone (purple rectangle). The bounce also seems like a countertrend retracement and if any higher highs, it could be limited as shown by the white arrow. Still, the MACD could meander around within its own symmetrical triangle. There is a risk of a downside breakdown as shown by the next chart.
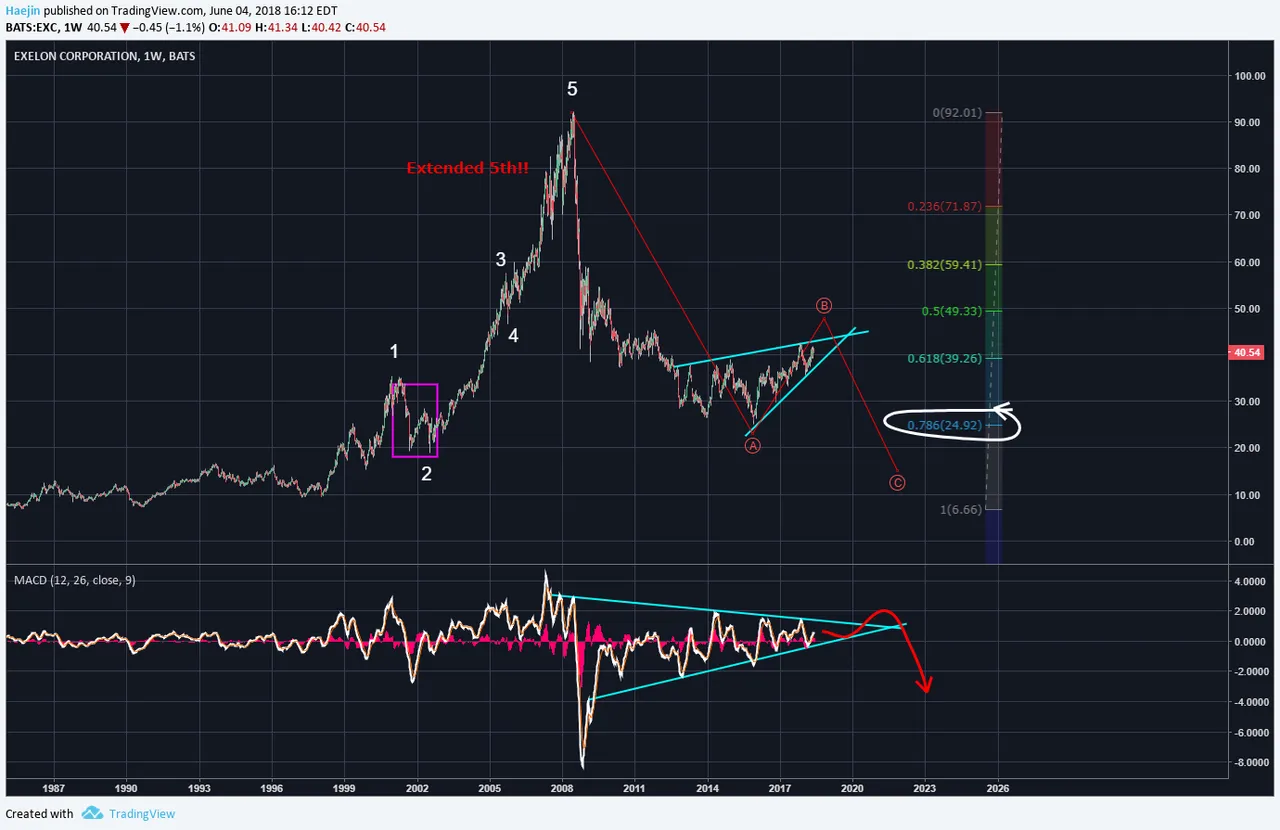
The blue upwards wedge could be bearish and actually be the red B wave of the ABC corrective sequence. IF this is the case, 0.88 Fib level could be a future stop. Would you be a buyer or a profit taker at this point?
Legal Disclaimer: I am not a financial advisor nor is any content in this article presented as financial advice. The information provided in this blog post and any other posts that I make and any accompanying material is for informational purposes only. It should not be considered financial or investment advice of any kind. One should consult with a financial or investment professional to determine what may be best for your individual needs. Plain English: This is only my opinion, make of it what you wish. What does this mean? It means it's not advice nor recommendation to either buy or sell anything! It's only meant for use as informative or entertainment purposes.
--

