A chart is not a chart in trading. The price action you see on a chart can represent years or it can represent only the last hour or so, it depends on which time frame you use.
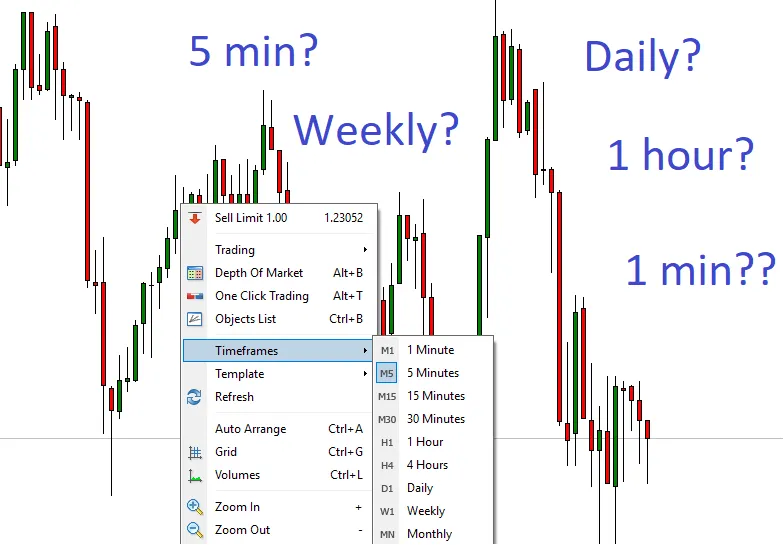
The time frames that are used in trading can broadly be divided into the higher and the lower time frames.
Higher time frames
Examples: 4 hour, Daily, Weekly and Monthly.
Lower time frames
Examples: 1 hour, 30 minutes, 15 minutes, 5 minutes and 1 minutes.
These are the standard time frames that you typically will find with most chart packages. Some markets offer slightly different time frames, like the 3 minute chart instead of the 5 minute charts. And the more advanced chart services will also offer a chart template where you can define your own time frame. 2.3 minute charts anyone? 😁
Which time frame to use?
The question should rather be “what kind of trader are you?”
Are you an active trader or a long term investor?
The lower time frames show more of the market noise. At this level you cannot rely so much on indicators or patterns since the price actions will not be very smooth or predictable. So in order to succeed here you will need to be a discretionary trader, and use scalping style techniques.
However for an active trader, or a day trader, these time frames offer more opportunities to enter, and you can pinpoint entries and exits from the price action.
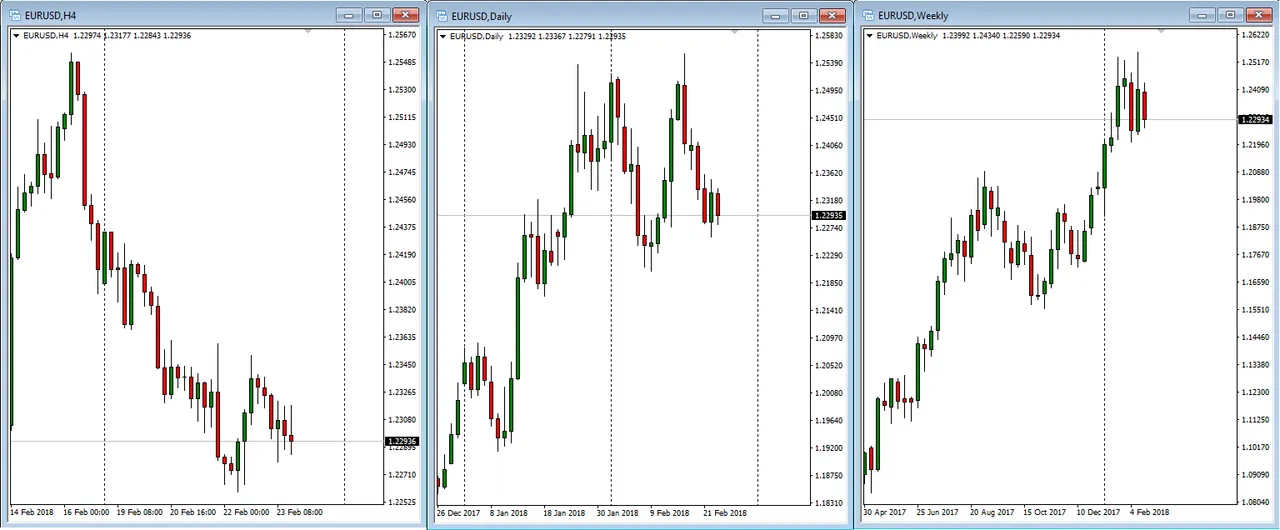
The higher time frames show a bird’s-eye view of the market, it is zoomed out, and you can see the big picture of the price moves. The trends you see here will correlate to the macro economic situation in the asset or currency, and is thus more reliable for future projections. Also, the indicators, patterns and price action markers will be more reliable here.
So if you do not have much time to spend in the markets and if you are a long term investor you do not need to bother with the lower time frames. There will be fewer opportunities to enter the market, but you do not need to monitor it, it is enough to check in once a day or a couple of times a week.
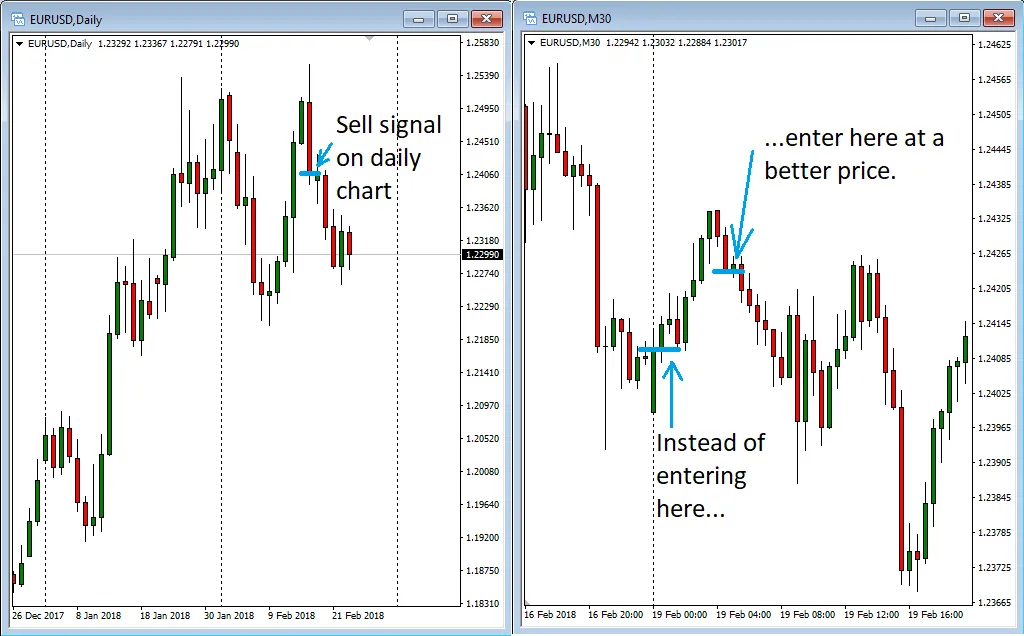
However, many longer term traders do zoom in, once they get a signal on their daily chart, to better time the entry of their trade. Instead of entering the trade at the candle close, you can for example zoom in to the 30 minute chart, and monitor the market to get a better entry like this:
How I use charts
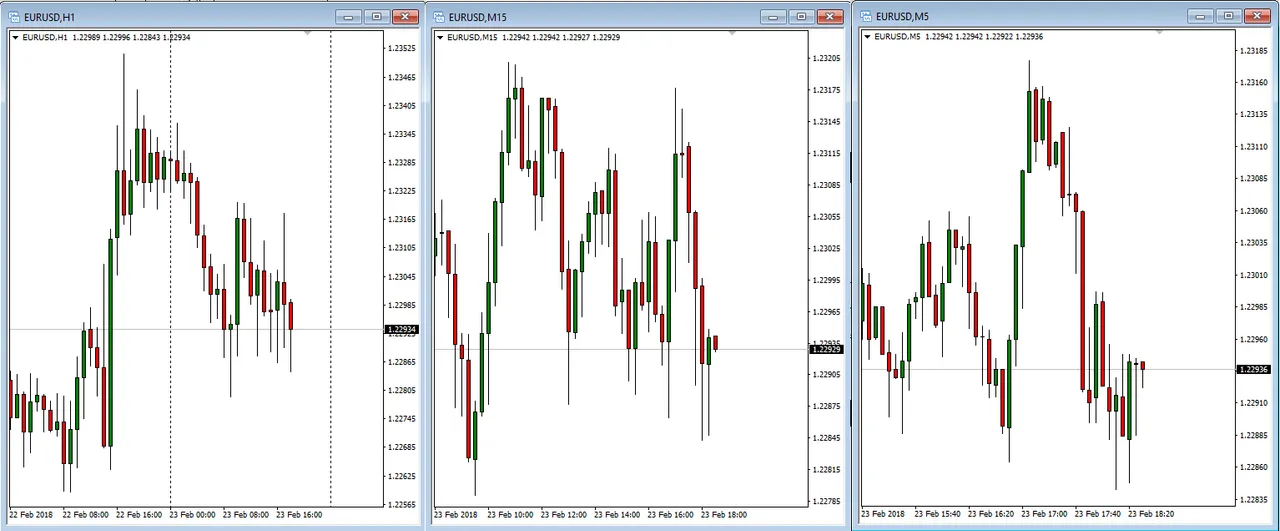
I am predominantly a price action trader, so I do not rely much on indicators. Instead I use multiple time frames as part of my analysis. I want to know the long term situation and trends on the daily and weekly charts, but I also want to use the lower time frames to better follow the intraday price action.
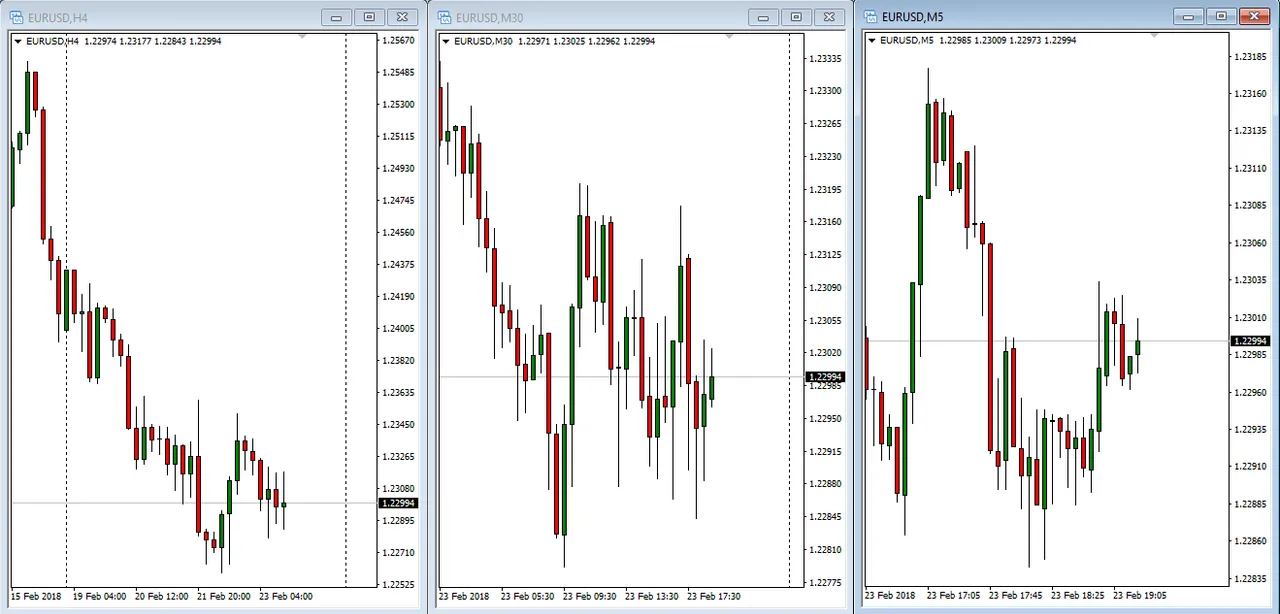
I use a zoom-in method where I start at the weekly and zoom in gradually to about the 15 minute chart. When I feel I have gotten a feel for the market i am trading I will have about 3 charts open at the same time with 3 different time frames, like this:
The trick I use when I browse through different markets (like cryptos, fiats, idicies, etc) to find one I feel is tradable is to look for two things:
- Smooth price action with a directional bias (trending)
- Enough volatility to profit from it
So I look for instruments that show the most fluent motion, without noise, and I look in particular for clear waves with rallies and pullbacks.
Consider the following two charts:
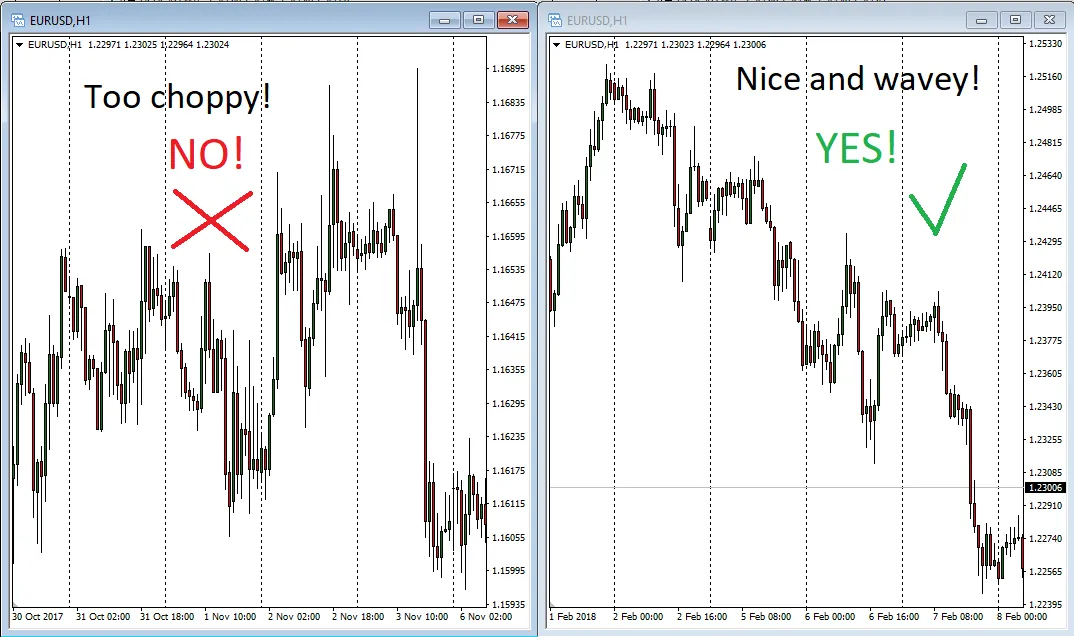
In the first chart the price action is choppy, there is no clear trend, and the range of the moves is not long enough to be very profitable. So that one is a pass.
However, the second chart shows fluent and directional price moves. And the range is good enough. So this one I would consider trading.
Fractal theory
I want to add briefly that there is a theory behind using multiple time frames to get a good grip on which instrument to trade. And that theory comes from mathematics and chaos theory and involves fractals.
Basically, fractal theory in trading involves repeating cycles within other larger repeating cycles. The markets notoriously repeat themselves in cycles, and the theory says that if you zoom in you will see that the larger cycles represent a series of smaller cycles. So if you zoom in or out through different time frames you will see the same kind of patterns and they are similar in nature.
These kind of repeating patterns can be seen in Elliot wave analysis and Bill William’s system to name just a few.
In closing
The best time frame is the one that works for you. No matter what other traders use, you must find the time period that resonates best with you. And remember, any time frame you choose will show the same price and price movements, it is just a matter of how zoomed in or out you are.