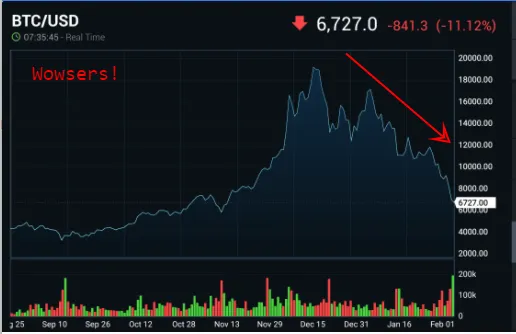
What is this, a BTC chart?
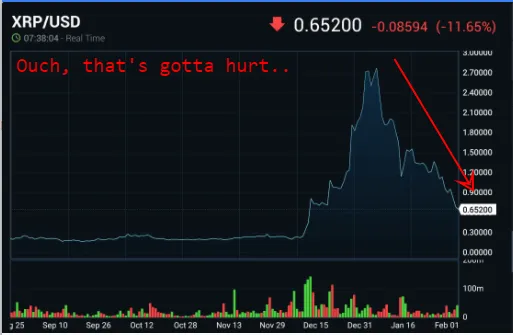
Ripple maybe?
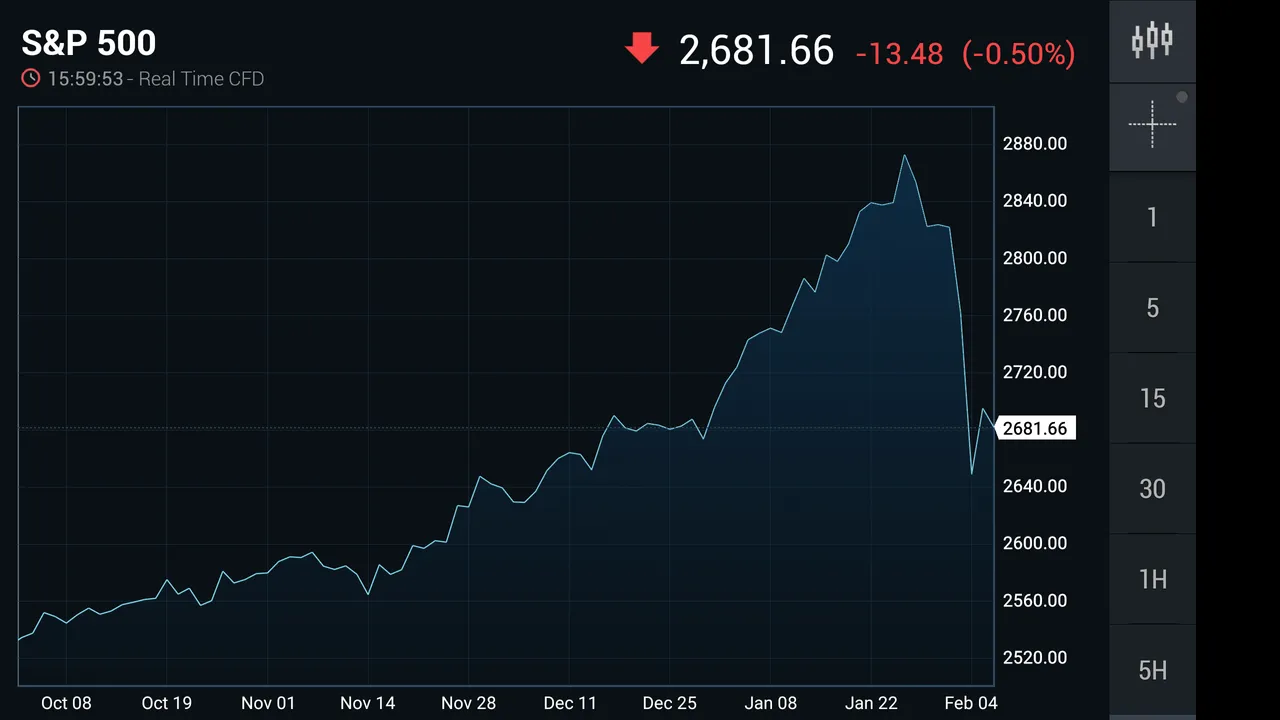
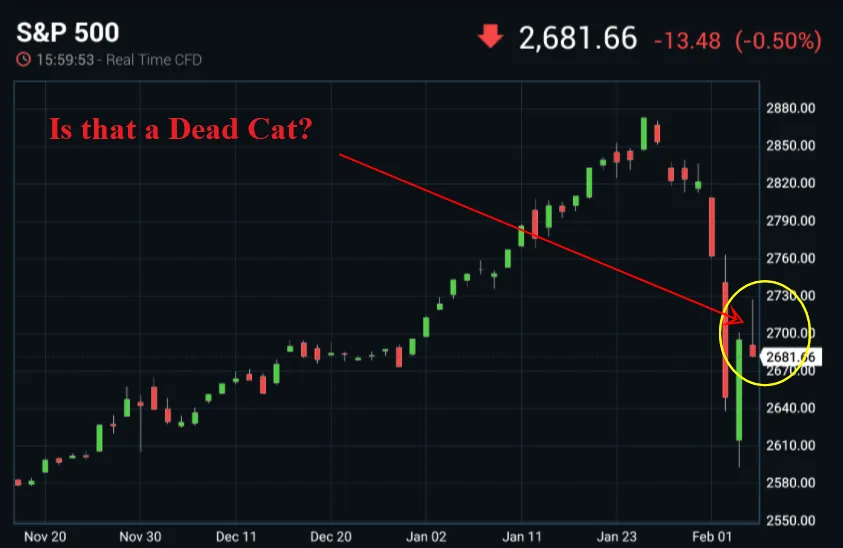
The STOCK Market! wait, What?!
Okay, corrections happen no biggie... Cramer says buy the dip and he has a television show so...
But wait, is that... is that a dead cat?
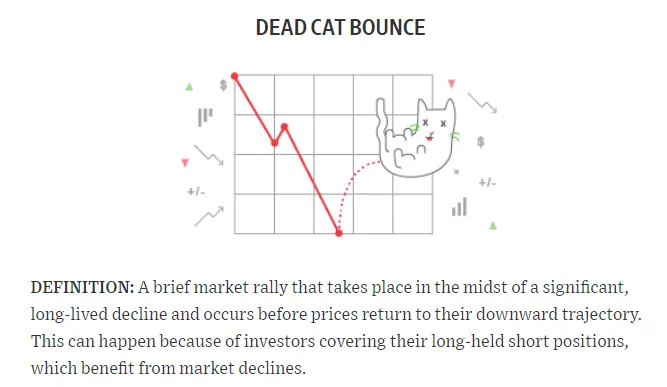
The WallStreetJournaldefines a dead cat bounce as such:
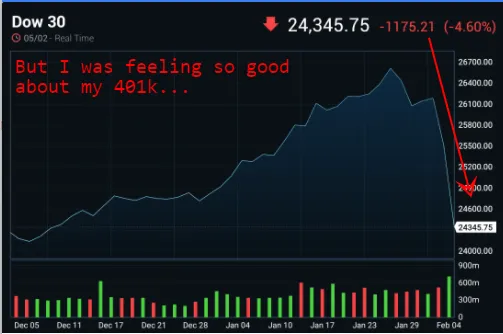
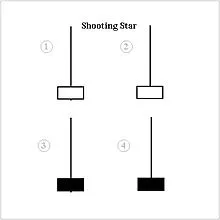
Even worse, what raises my spider-sense is that last red candle on the right side of the chart. It's what known as a "Shooting Star". In technical analysis, a shooting star is interpreted as a type of reversal pattern presaging a falling price.
I was fully expecting the general market correction to be short lived, because y'know.. the PlungeProtectionTeam. Now I'm not so sure..
One things for certain though, we're gonna need to strap in because,
Volatility is BACK!
And it's going to be a bumpy ride.
Until Next Time

It's your move.
JESS
Thanks for reading, if you enjoyed this rant, you might also enjoy some of my Recent Articles:
"I think they're all Worthless. I think they're the 21st century version of a Chain Letter"