
SUMMARY
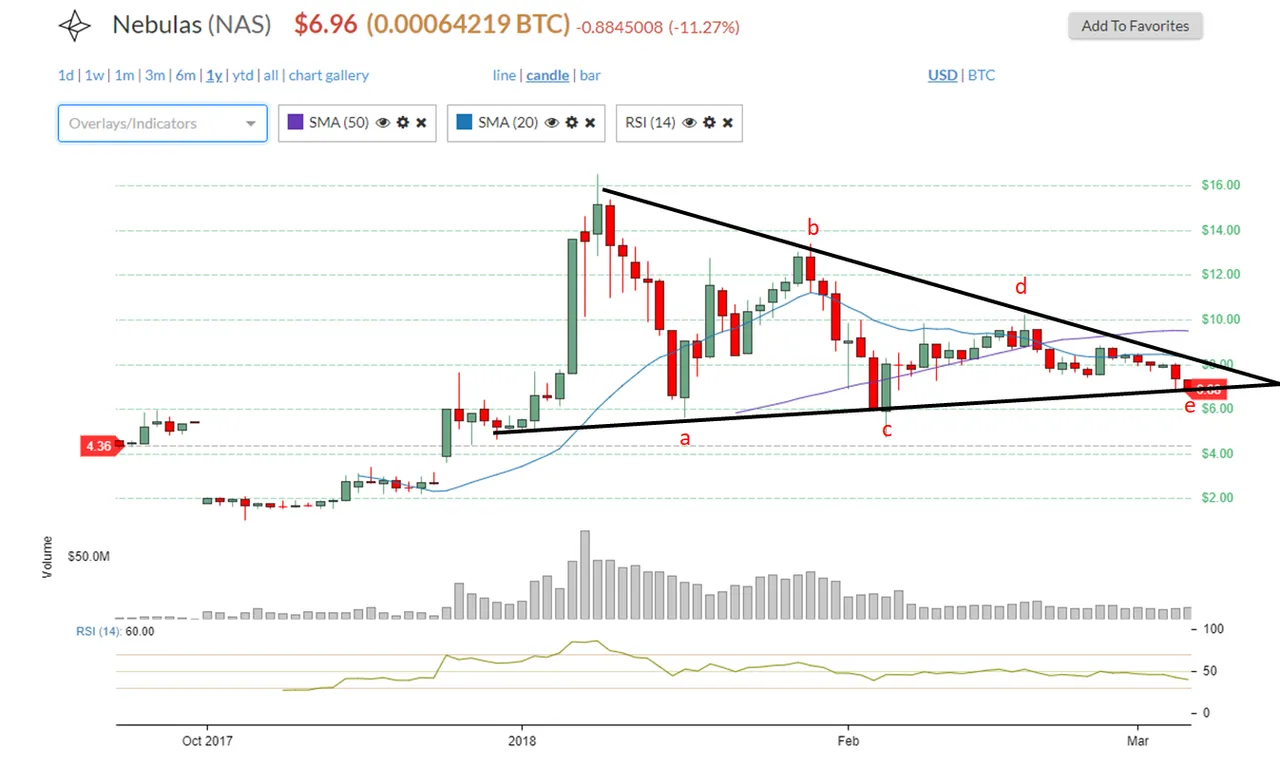
Nebulas (NAS/USD) chart is difficult to ascertain as it is not available in Tradingview or Coinigy. The below chart was capture from Bitscreener and analyzed using Powerpoint for labels. Still, the chart looks beautifully bullish. Why? I've always maintained that the most ideal time to buy is at the terminal ends of a correction. This a,b,c,d,e waves fit very well into the triangle pattern. Given the proximity of the price to the Apex, the point at which the triangle lines intersect, the odds are that price will break to the upside.
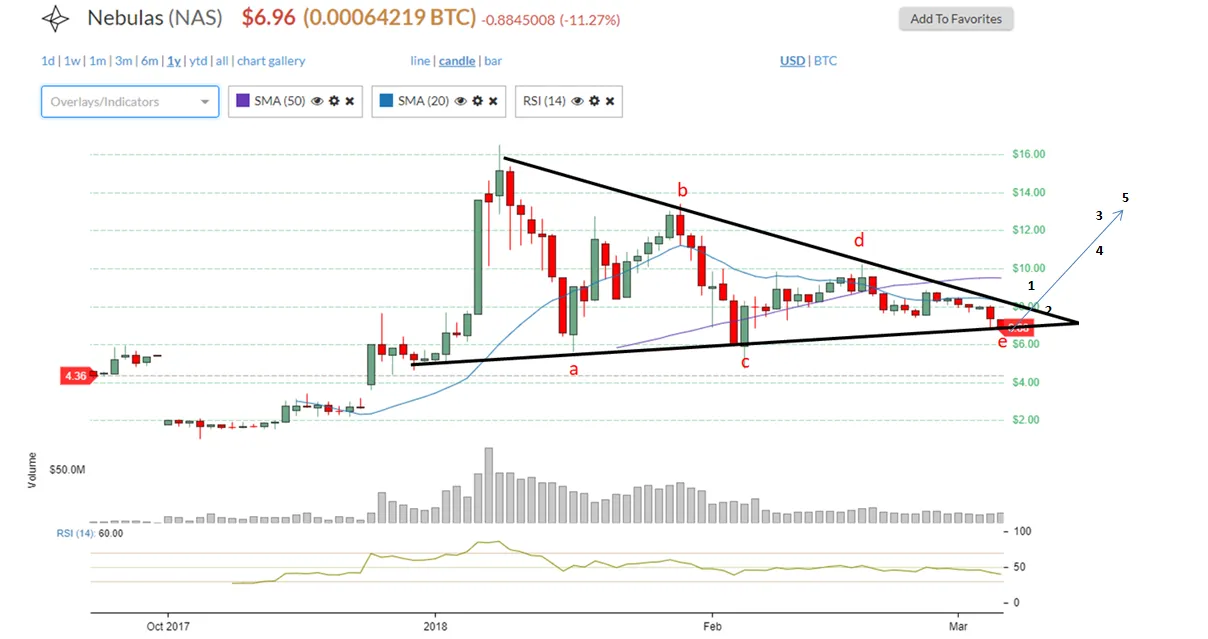
While Powerpoint doesn't have Fib charts or EW prelabels; I've done best possible to physically place the Elliott Waves along an ascending arrow. The condition of this move is the the bottom support of the triangle must hold. There might be a brief piercing of it for bull wick effects, but it must not be breached decisively.
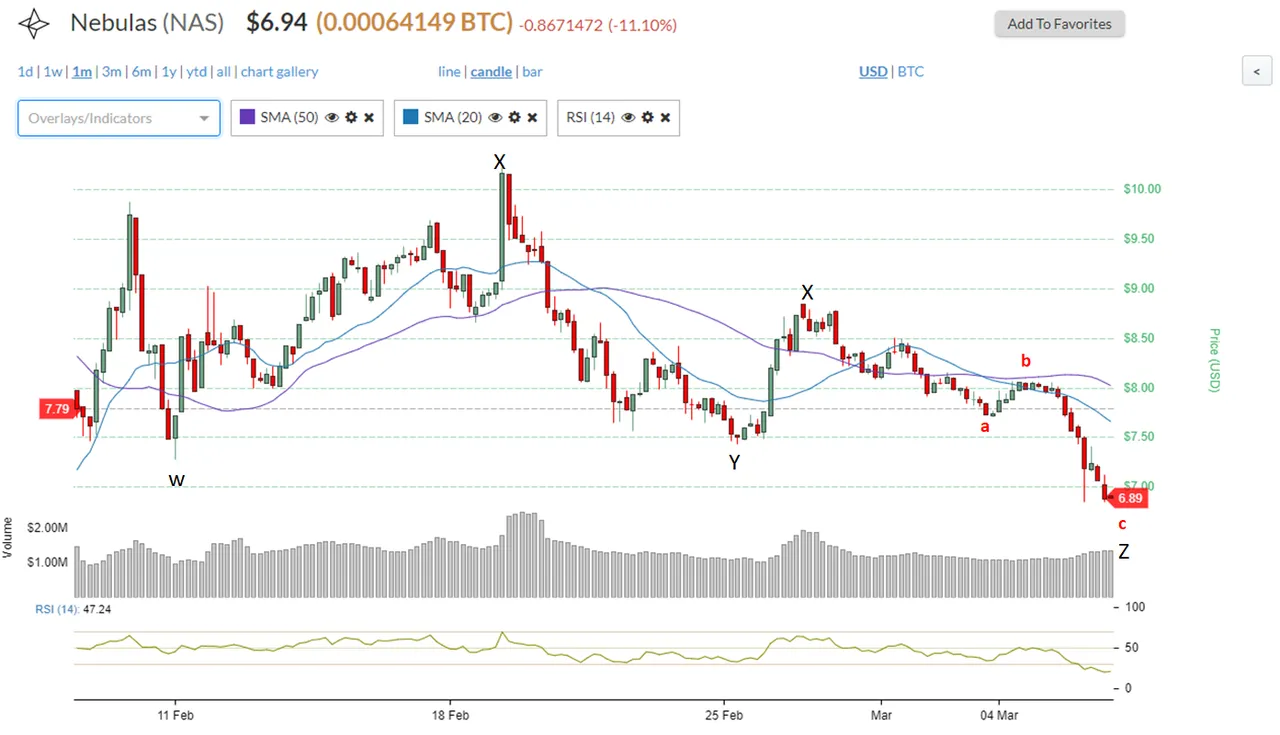
Here is a closeup of the chart. It can be labeld as a WXYXZ and the final Z is sublabeled as red a,b,c. There is good probability that the correction could be almost done; even with a bit lower low prices. Attractive ladder cast entry.
Legal Disclaimer: I am not a financial advisor nor is any content in this article presented as financial advice. The information provided in this blog post and any other posts that I make and any accompanying material is for informational purposes only. It should not be considered financial or investment advice of any kind. One should consult with a financial or investment professional to determine what may be best for your individual needs. Plain English: This is only my opinion, make of it what you wish. What does this mean? It means it's not advice nor recommendation to either buy or sell anything! It's only meant for use as informative or entertainment purposes.
Please consider reviewing these Tutorials on:
Elliott Wave Counting Tutorial #1
Elliott Wave Counting Tutorial #2
Elliott Wave Counting Tutorial #3
Laddering and Buy/Sell Setups.
Laddering Example with EOS
Tutorial on the use of Fibonacci & Elliott Waves
@haejin's Trading Nuggets
Essay: Is Technical Analysis a Quantum Event?
Follow me on Twitter for Real Time Alerts!!
Follow me on StockTwits for UpDates!!
--
--

