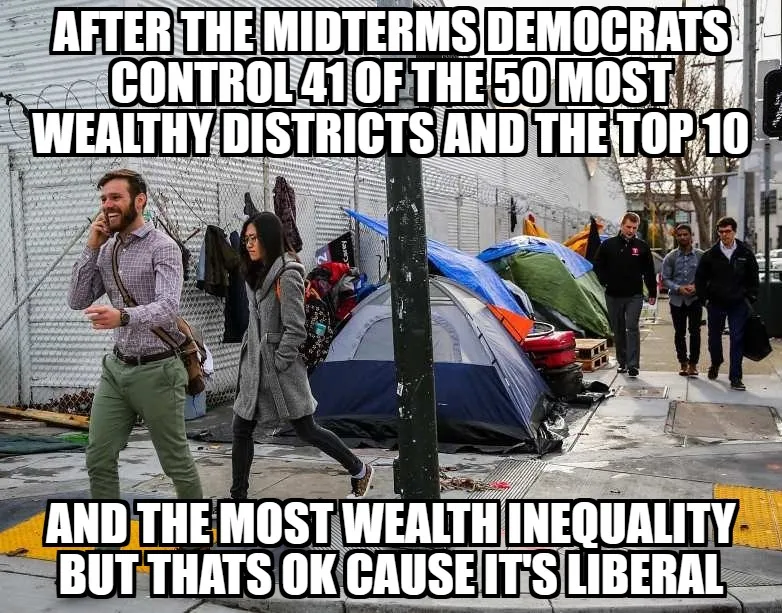
Democrats Now Control The Wealthiest Districts And The Most Unequal
After the 2018 Midterms, not only does the Democratic party control 41 of the 50 most wealthy but the top 10 most wealthy as well. To provide some contrast, gander the other end of the spectrum. In 2014 Politifact reported that 95 of the 100 poorest counties were Republican, based on median household income.
The Top 10 Wealthiest Districts in the US By Median Household Income
- Congressional District 10, Virginia: $116,069 | Democrat
- Congressional District 18, California: $112,702 | Democrat
- Congressional District 17, California: $107,946 | Democrat
- Congressional District 11, Virginia: $105,024 | Democrat
- Congressional District 7, New Jersey: $104,987 | Democrat
- Congressional District 3, New York: $104,805 | Democrat
- Congressional District 11, New Jersey: $103,419 | Democrat
- Congressional District 8, Virginia: $100,649 | Democrat
- Congressional District 33, California: $99,902 | Democrat
- Congressional District 8, Maryland: $97,663 | Democrat
Democrats Also Control The Most Unequal Districts
By using the Gini index we can quantify which areas have the most disparity between incomes. The index ranges from 0-1, 0 (0%) would reflect perfect equality and 1 (100%) would reflect perfect inequality.
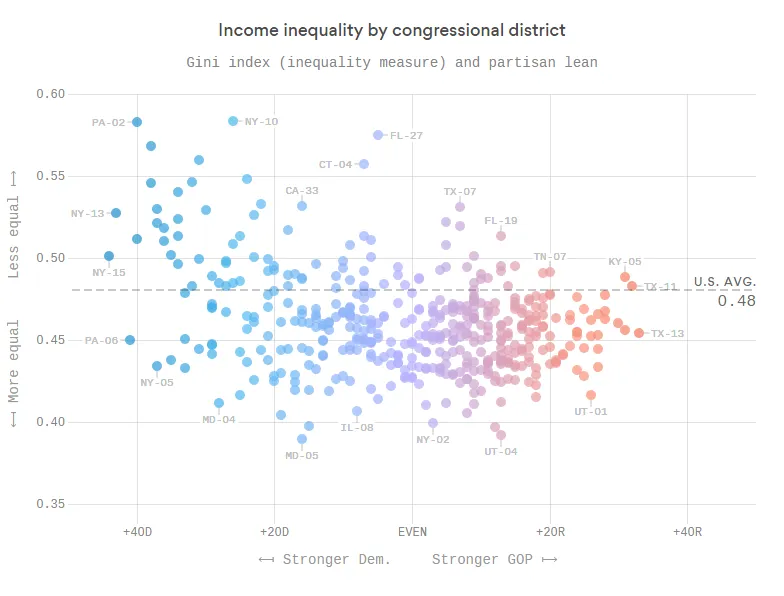
The graphic shows that red districts are more likely to have similar incomes. While Democratic zones tend to have more households with incomes over $200,000 than Republican zones, they also have more households with incomes lower than $10,000 than Republican districts. The overarching trend being that the more Democratic an area, the greater the wealth inequity.
According To The Gini Index The Most Unequal Districts Would Be:
- Congressional District 2, Pennsylvania | Democrat
- Congressional District 10, New York | Democrat
- Congressional District 27, Florida | Democrat
- Congressional District 7, Illinois | Democrat
- Congressional District 12, New York | Democrat
These Counties Are The Most Unequal Of The Richest Counties:
- Congressional District 10, New York | Democrat
- Congressional District 4, Connecticut | Democrat
- Congressional District 12, New York | Democrat
- Congressional District 33, California | Democrat
- Congressional District 3, New York | Democrat
To End On A Less Polarizing Note
The University of Pennsylvania completed a study which identified Republicans as more charitable while taking into account socio-economic differences. On average the study showed that Republicans donate $60-160 more per year than Democrats. The researchers concluded that this difference was not based on public policy stance but on religious practice based on the fact the there is strong correlation between church attendance and charity given.
I do understand that Republicans have done some very heinous things as well and I agree there are some very bad Republicans. Specific examples come to my mind like Dennis Hastert or the Bush dynasty. But we cannot let perfection be the enemy of improvement. If equity is desired, less poverty and not to be ruled over by an elitist "liberal" corporate super-class, do not vote Democrat! They want us dependent, dumb and weak.
If you have any thoughts, please comment below, I'd love to hear from you all...

🐦 TWITTER @newtreehints
🎬 DTUBE @newtreehints
📷 NSTGRM @newtreehints
https://finance.yahoo.com/news/midterms-one-party-controls-wealthiest-184200649.html
https://www.axios.com/income-inequality-blue-red-districts-641c4e96-327c-4237-91a5-6613ad80cff5.html
https://www.forbes.com/sites/andrewdepietro/2018/11/08/democrats-wealth-inequality-congressional-districts/