ODEM (ODEUSD) has broken out of the triangle pattern in the daily chart.
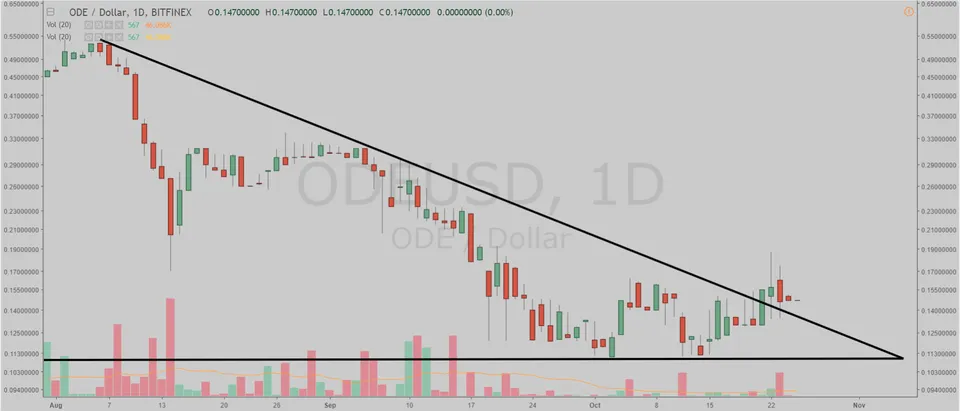
(Chart courtesy of Tradingview.com (log scale))
Elliott Wave Analysis
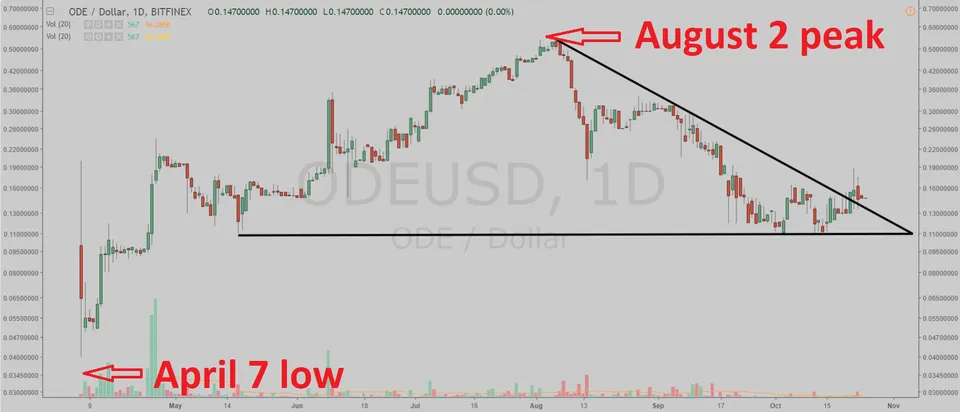
In Elliott Wave terms, ODEM began a wave one advance on April 7. The red wave one (blue sub-waves i-ii-iii-iv-v) finished on August 2, and the red wave two (blue sub-waves a-b-c) correction ended on October 3. If this wave count is correct, ODEM should be heading next towards the August 2 peak in the red wave three.
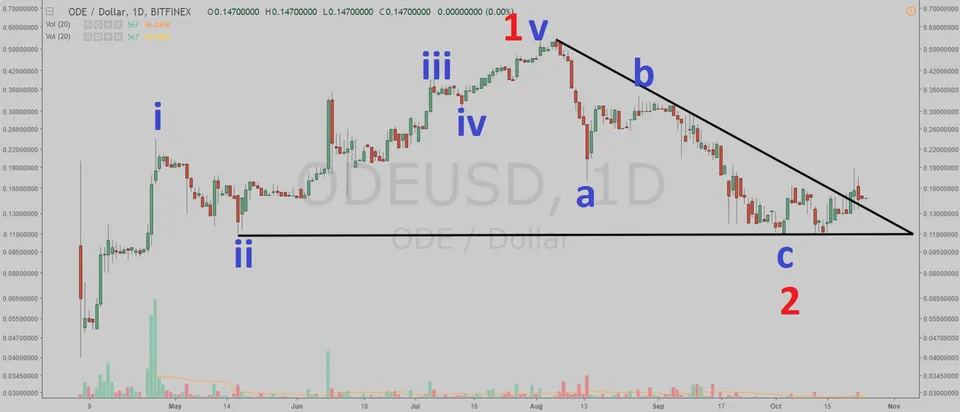
(Chart courtesy of Tradingview.com (log scale))
Funnymentals
ODEM is a global, decentralized education marketplace. You can view their detailed presentation below.

(Sources: https://odem.io/ and YouTube)

If you think this analysis is correct, upvote this post (min $0.01) and upvote the comment (min $0.01) "ODEM will takeout the August 2 peak".
If you think this analysis is wrong, upvote this post (min $0.01) and upvote the comment (min $0.01) "ODEM will drop below the April 7 low".
If you think ODEM is in a range, upvote this post (min $0.01) and upvote the comment (min $0.01) "ODEM will stay in a trading range between the April 7 low and the August 2 peak until November 29".
(Chart courtesy of Tradingview.com (log scale))
You can upvote the comment until 3 PM EST October 28 and you can upvote only one comment. 50% of liquid STEEM + SBD from this post will be distributed equally to the winners. The winners will be determined by the price action (which one happens first).
Bonus 1
I will be sending one Trophy Token (@trophy-token) to everyone who manages to get these crypto contests right seven times in a row. If/when you accomplish this, please contact me at Steemit Chat with your BitShares address.
Bonus 2
Upvote the right comment and the main post with at least $0.10 and you will get 3 x the winning prize.