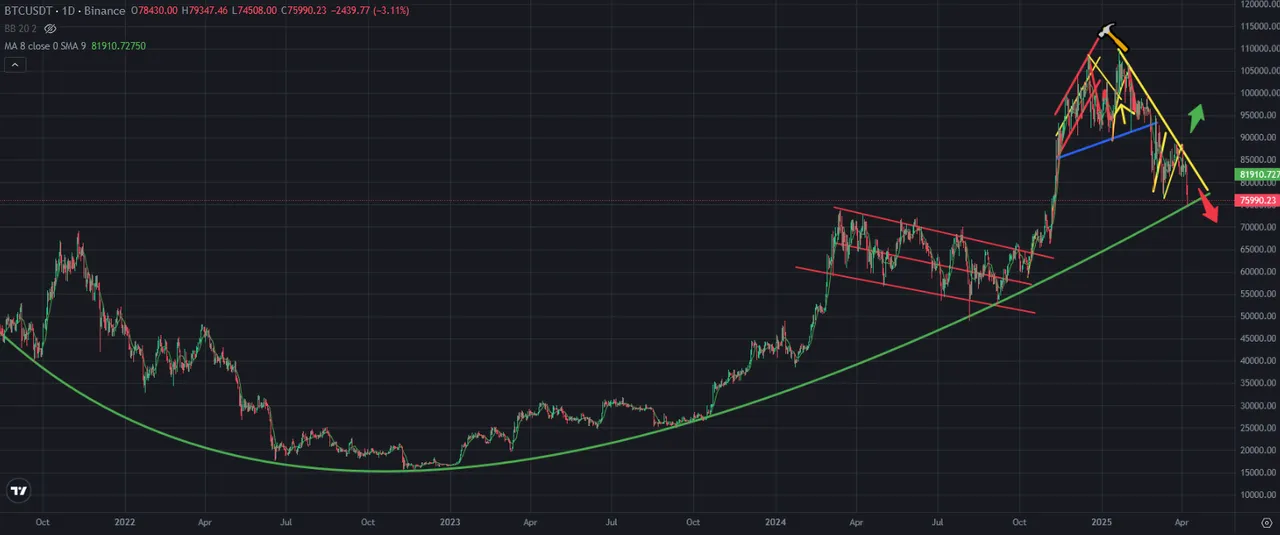
There was great support line on Bitcoin price chart coming from end of 2021. There is great bowl pattern on Bitcoin price chart. After market crash, Bitcoin price touched this great support line today. Will it break down?
Here you can see daily chart of Bitcoin. If Bitcoin price breaks down this great support line, we may see huge drops on market. We may see the end of crypto market. It is very hard to predict the price target after breaking down this great support line. Bitcoin price is in bowl pattern.
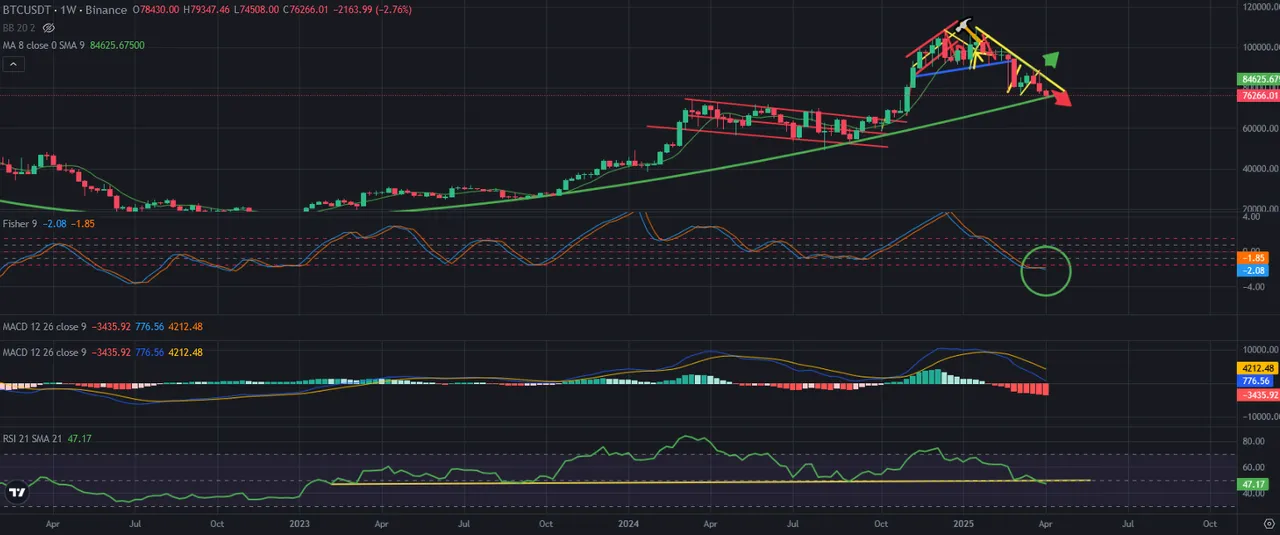
Here you can see weekly chart of Bitcoin and the indicators. MACD Indicators is going down. Even Fisher Indicator is on the bottom, it may continue to go down.
There was great support line on RSI Indicator. It is broken down after weekly close on yesterday. It should be a bearish trap! If not, Bitcoin price may break down great bowl pattern. If it happens, we may see huge drops. It may be only the beginning..
We are at cricitical level for Bitcoin price chart. Price drop should end. If not, we will enter the new trend of price drop.
As I said, we are in critical moment for crypto and stock market.
I hope bowl pattern will support Bitcoin price chart.
We will see..