What are the new resistances after breaking the all-time high?
We will see
More than 2 weeks ago we saw that it broke the maximum of 59 dollars and today it touches the 120 dollars a 100% increase
I propose to analyze how far the price could go in the medium and long term by analyzing its capitalization and with a fibonacci extension to where the elliot waves could reach in the short or medium term.
In this case we could project with fibonacci levels, looking for future resistance.

Hive and Leofinance family needs your support, give the post a like, if you appreciate the content, help with your vote and you will also be helped by the hive family, thanks
In this case we could project with fibonacci levels, looking for future resistance.
Long Term Analysis
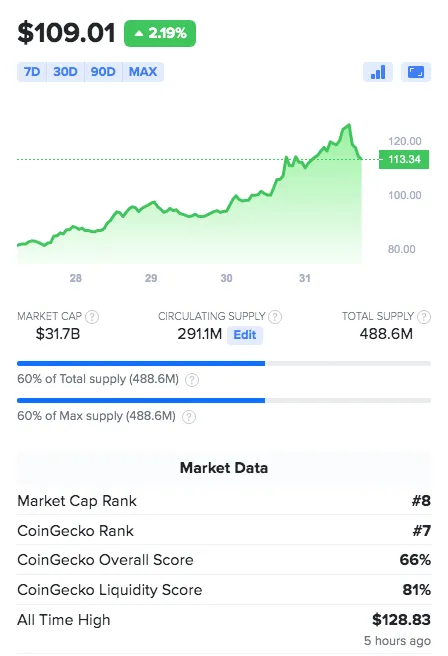
Solana is a currency that has quickly risen in price, touching today the price of 120 dollars. Today is number 8 in MarketCap has a capitalization of 32 billion. But until what price could reach in the long term
For that, it would be necessary to compare with another currency that has the same characteristics.
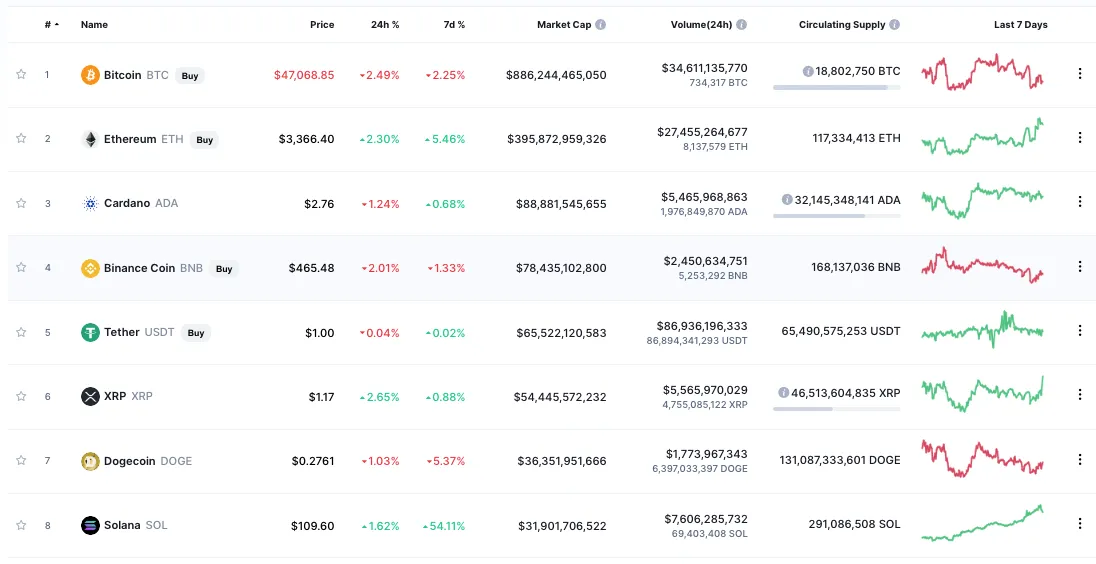
If we compare its capitalization with Ethereum, it could give us indications of what a maximum reference price would be, which it could reach in the future.
As we know at the time of making this post Ethereum has a capitalization of 396 Billion.
If we assume that solana could reach the capitalization of Ethereum in the future we would have to think that it would go from 32 trillion to 396 trillion. raising its price by one by 12.
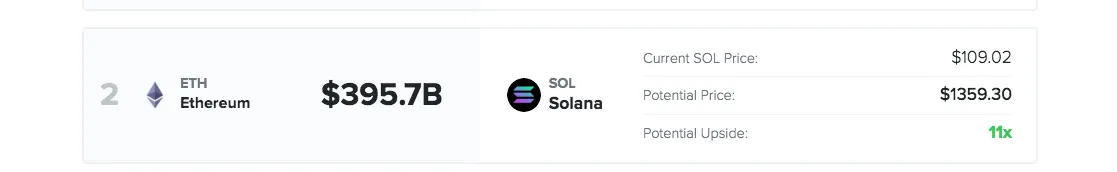
Graphics source: thecoinperspective
If it goes up one X12 the price could reach in the future, in the long term, the value of 1365 dollars.
This analysis is to have a reference value for the price of the crypto Solana, as far as the price of having the same capitalization of ethereum could go in the future.
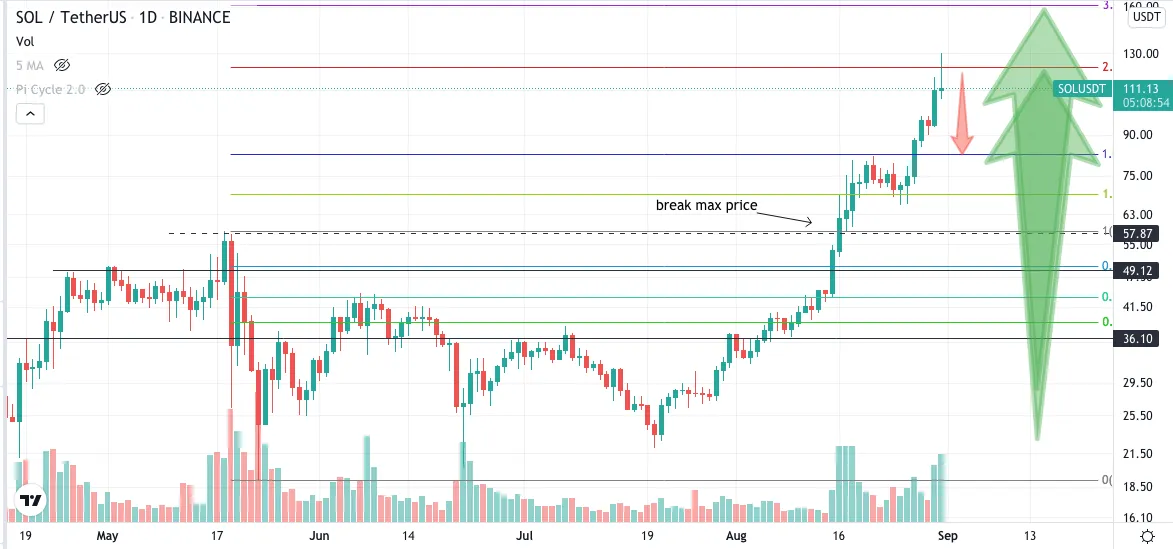
For a short-term analysis of what the Solana price could be, we can use Fibonacci.
Fibonacci SOL/UST projection.
Fibonacci Extension Analysis.
If we analyze the daily chart we see that when applying fibonacci in the last range that the price has fluctuated, and its projection that marks with its extensions we see that last week it has broken the resistance of 1.618 of the fibonacci extension and that it has been sustained at in the following days.
Which indicated that it was going to touch the next fibonacci extension target of 2.618.
This week it is still on the rise and today it reaches the next target, which would be the 2.618 fibonacci, around $ 120.
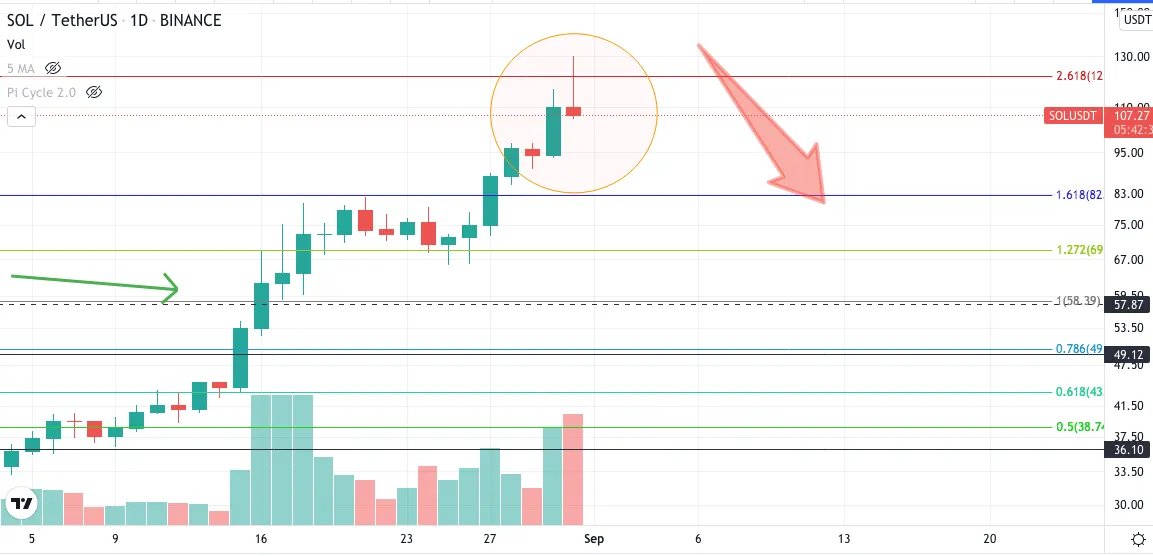
But today we see that after rising 17% at the time of doing this analysis, and reaching $ 120, an important resistance, it begins to show signs of short-term exhaustion.
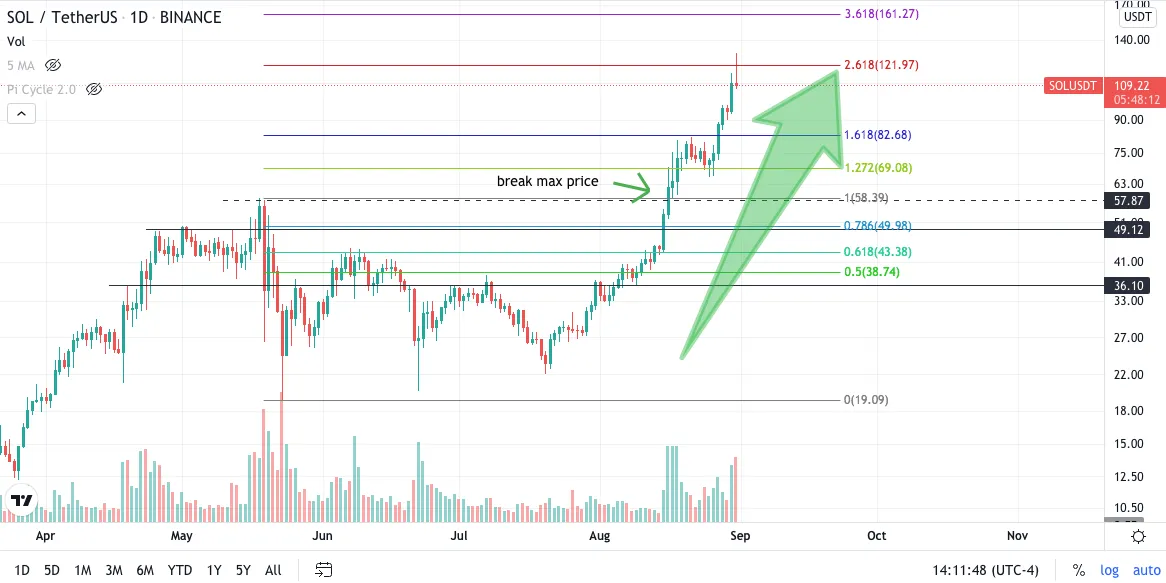
It should break it and stay above it and the next target would be the 3,618 fibonacci for $ 161.
The daily candle in the price that you are having at the time of making this post, is not a good one, it could be indicating that the price is going to correct in the short term.
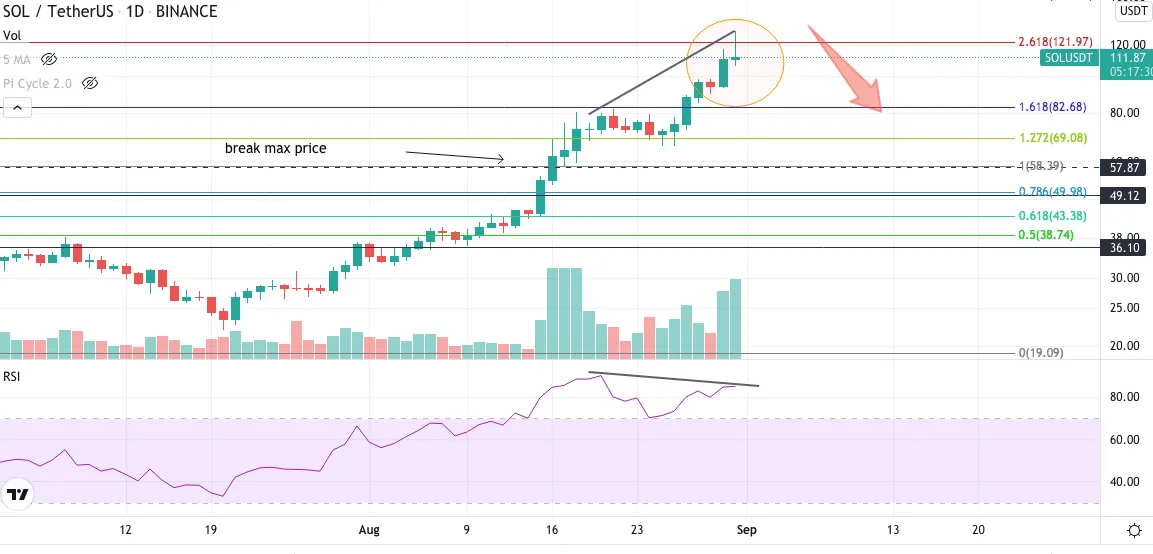
RSI
The daily rsi chart shows bearish divergence, another indicator that is negative in the short term.
If you are a Solana holder, what would you do to sell thinking that it could lower the price from 120 dollars or would you hold to the possible 1,350 dollars that it could reach in the next few years?
Remember to give your post a vote, Always support good content. Thanks
Follow me it costs you nothing and you get a Healing Reward with Your Vote
Protect your assets use Stop loss
The alcoins market is very dependent on the price of Bitcoin, when Bitcoins goes up the alcoins go up more, but also in the other sense, so I suggest that you periodically review a Bitcoin and use stop loss and move it when they are already in profit. Do not let a profit become a loss.
We will continue monitoring
To be attentive
Protect your Investments
Feel free to use and share my post or graphics, but please mention, @criptoar as the author. Otherwise, consider plagiarism and I will call you and advise my friends to do the same.
READ DISCLAIMER: this publication / analysis is only for general information purposes. I am not a professional trader and I will never be a financial advisor. The material in this publication does not constitute any trading advice of any kind. This is the way I see the paintings and what my ideas are.
Perform your own analysis before making an investment decision. Use money that you are willing to lose if you make an investment.
If you make exchanges or investments after reading this publication, it is entirely at your own risk. I am not responsible for any of your gains or losses. By reading this publication, you acknowledge and agree that you will never hold me liable for any of your profits or losses.
For your vote or comment, thank you
Leofinance