I don't know much about blockchain technically and I don't have deep knowledge about it.
I'm getting help by reading a well-described blog post about Hive.
@taskmaster4450 Thx.
So I'm going to try to deal with the chart rather than the technical part.
If you look at the Hive chart,
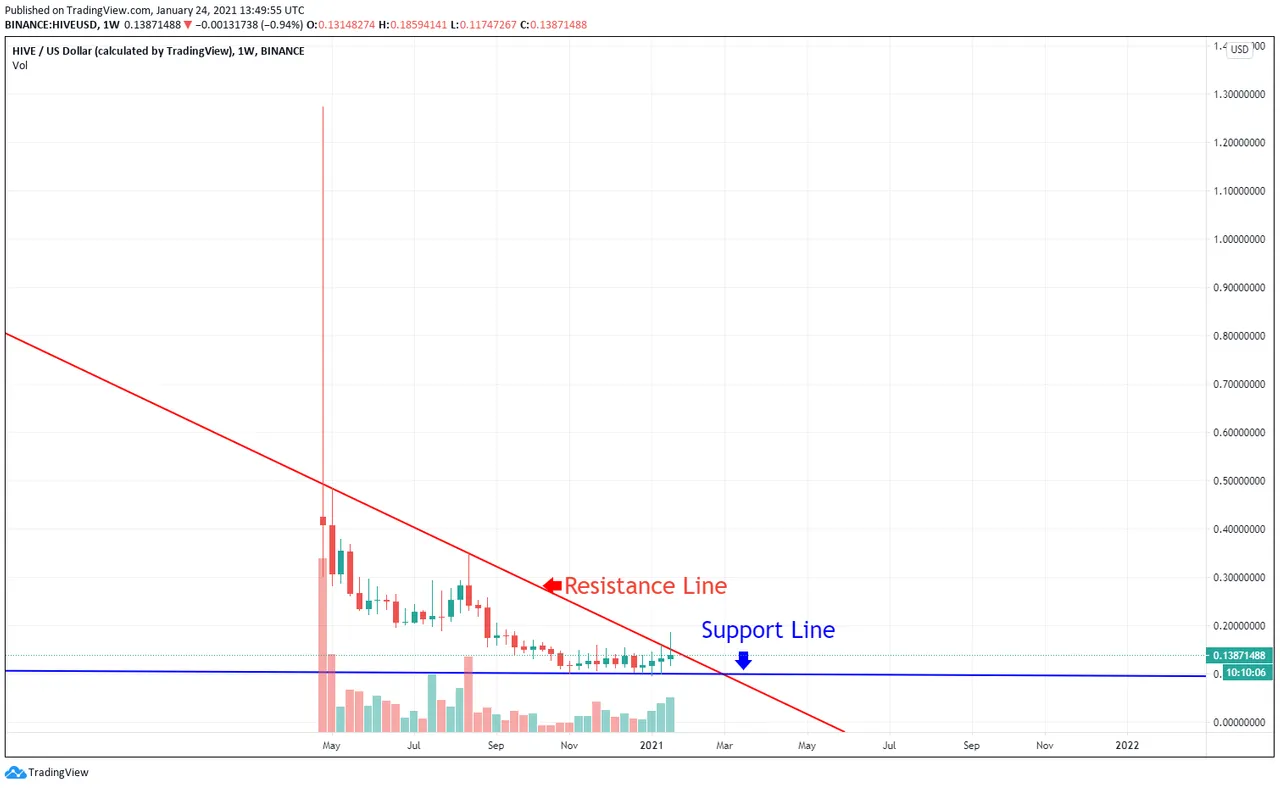
You can find signals that can rise in the chart over the long term.
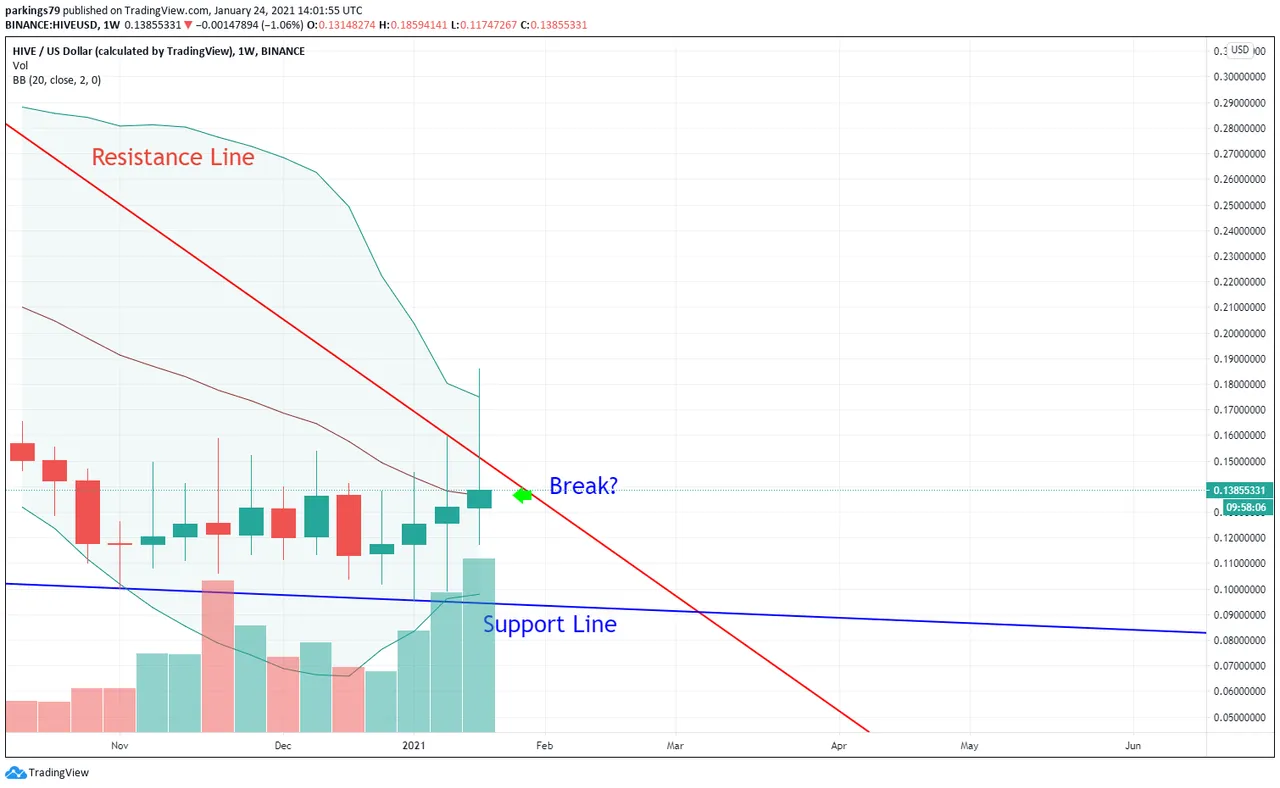
I think we should pay attention to the middle line of BB on the weekly chart.
Let's compare the charts of other coins.
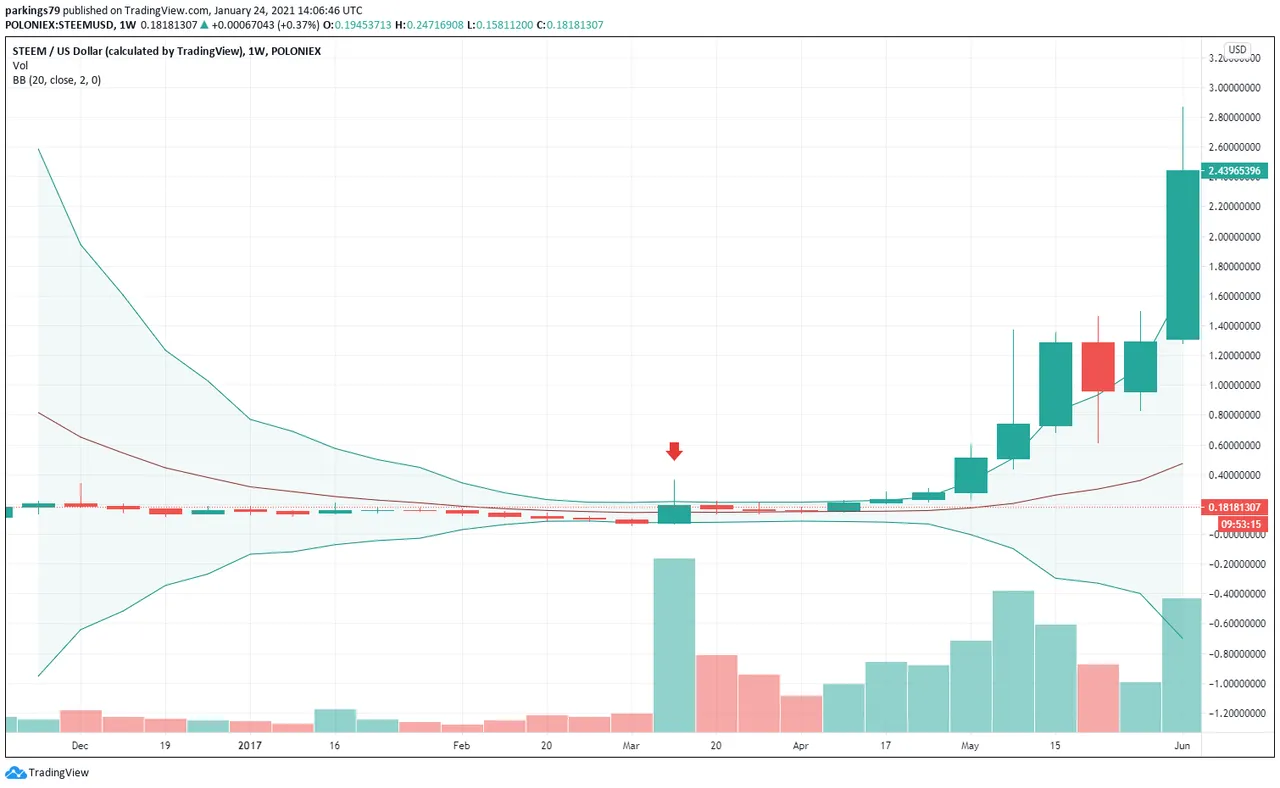
STEEM 2017 March chart
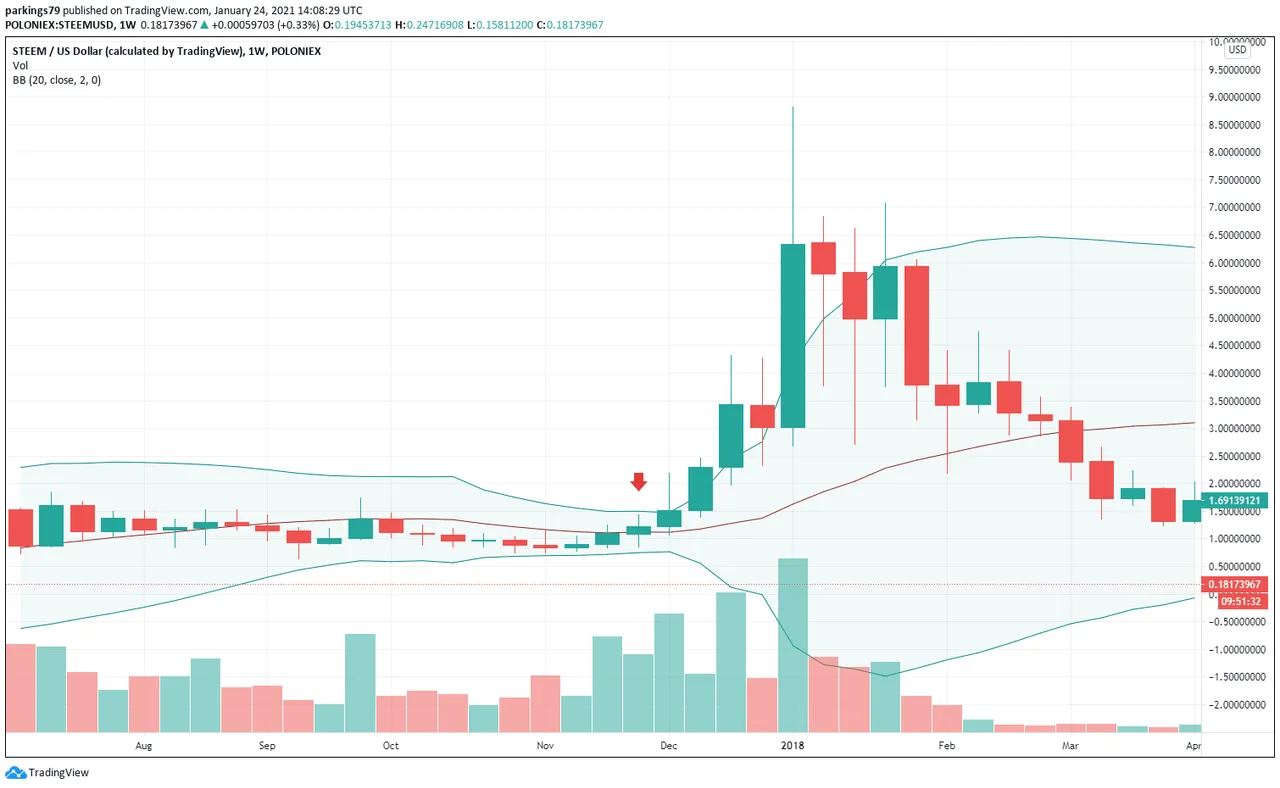
STEEM 2017 November
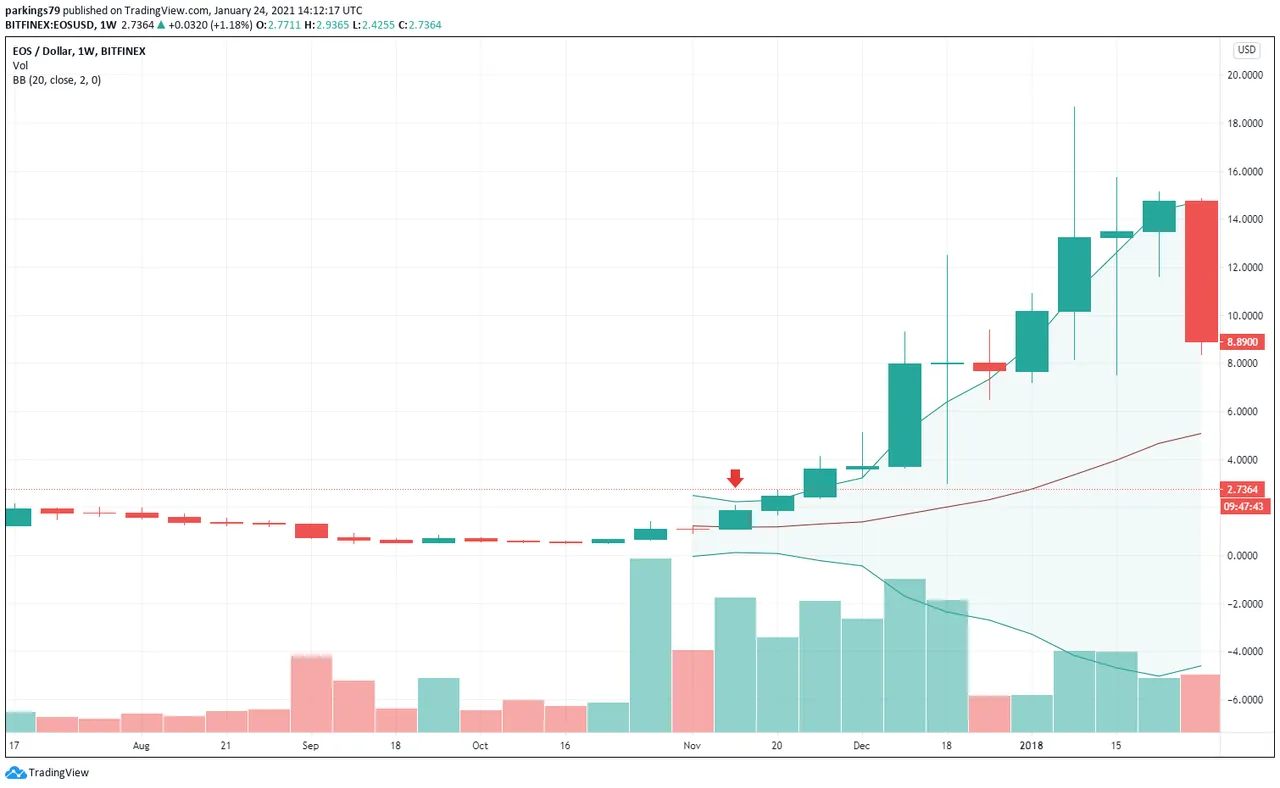
EOS 2017 November
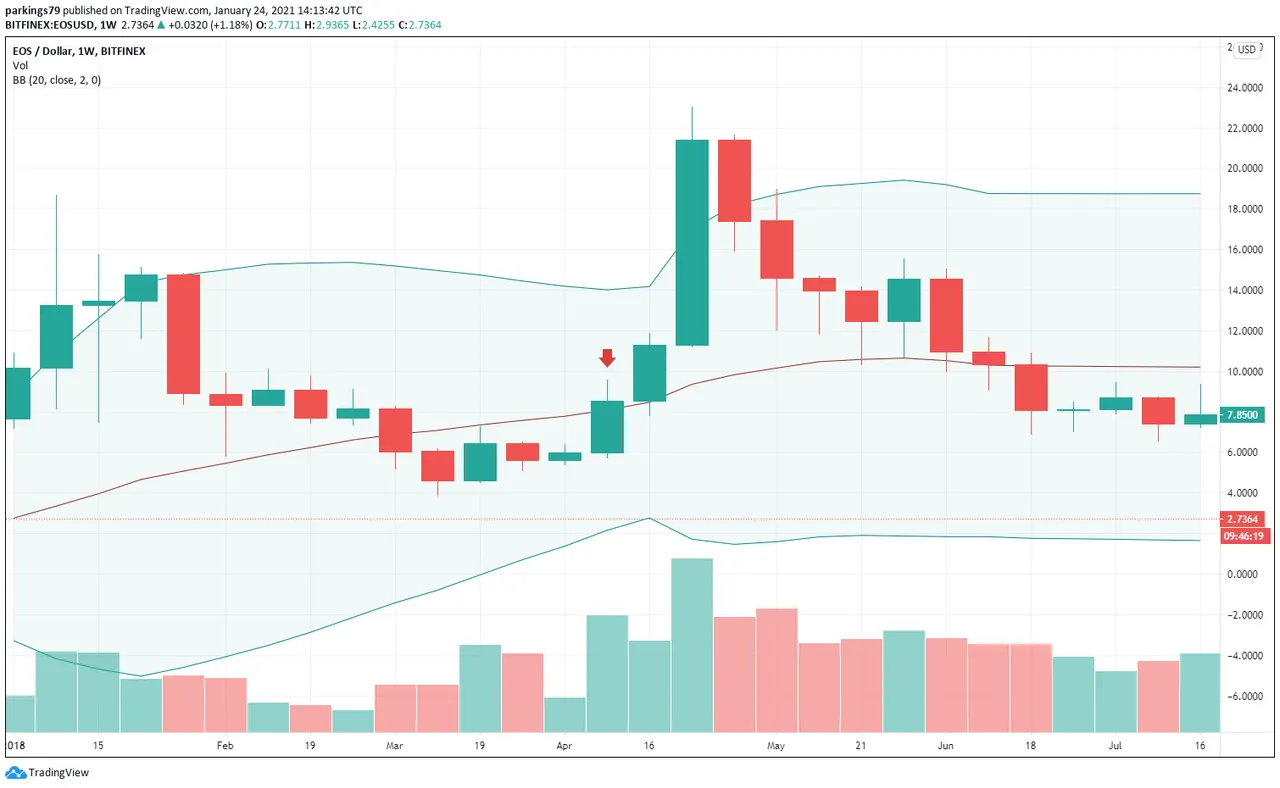
EOS 2018 April
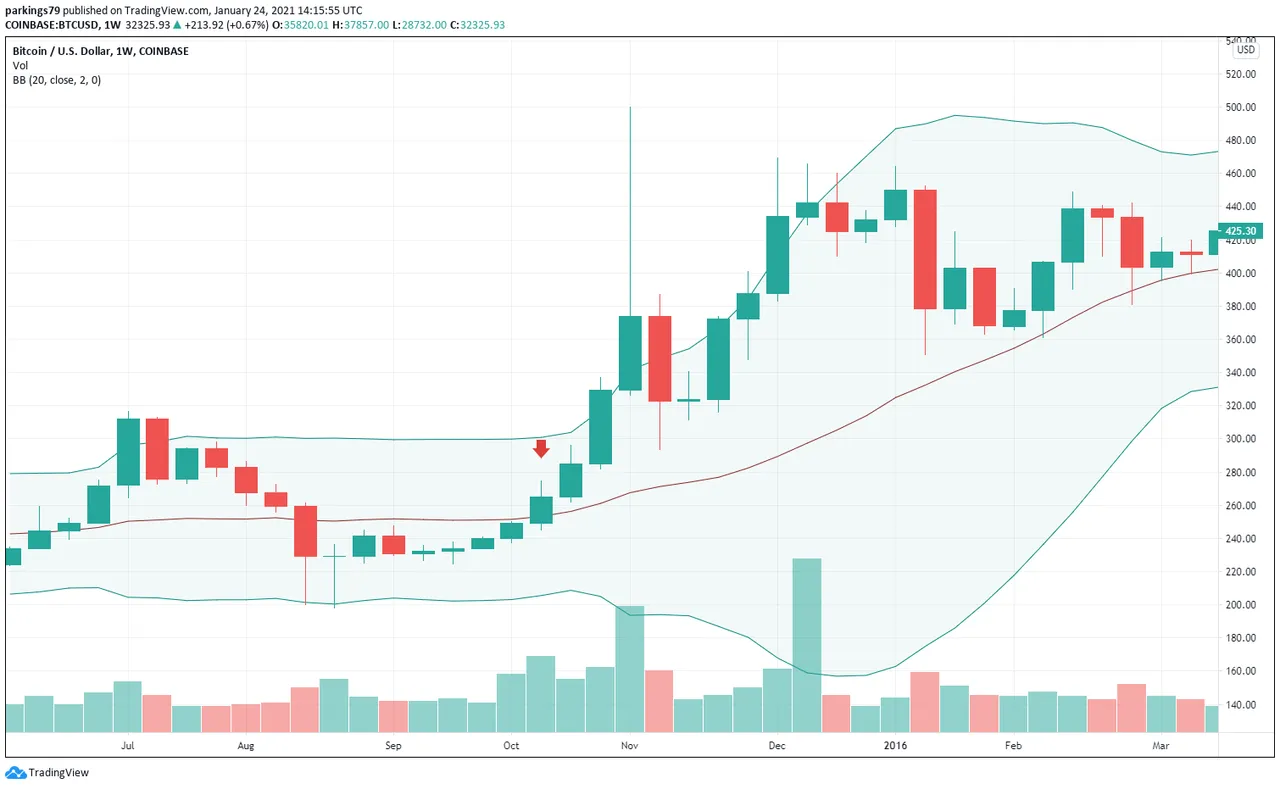
BTC 2015 October
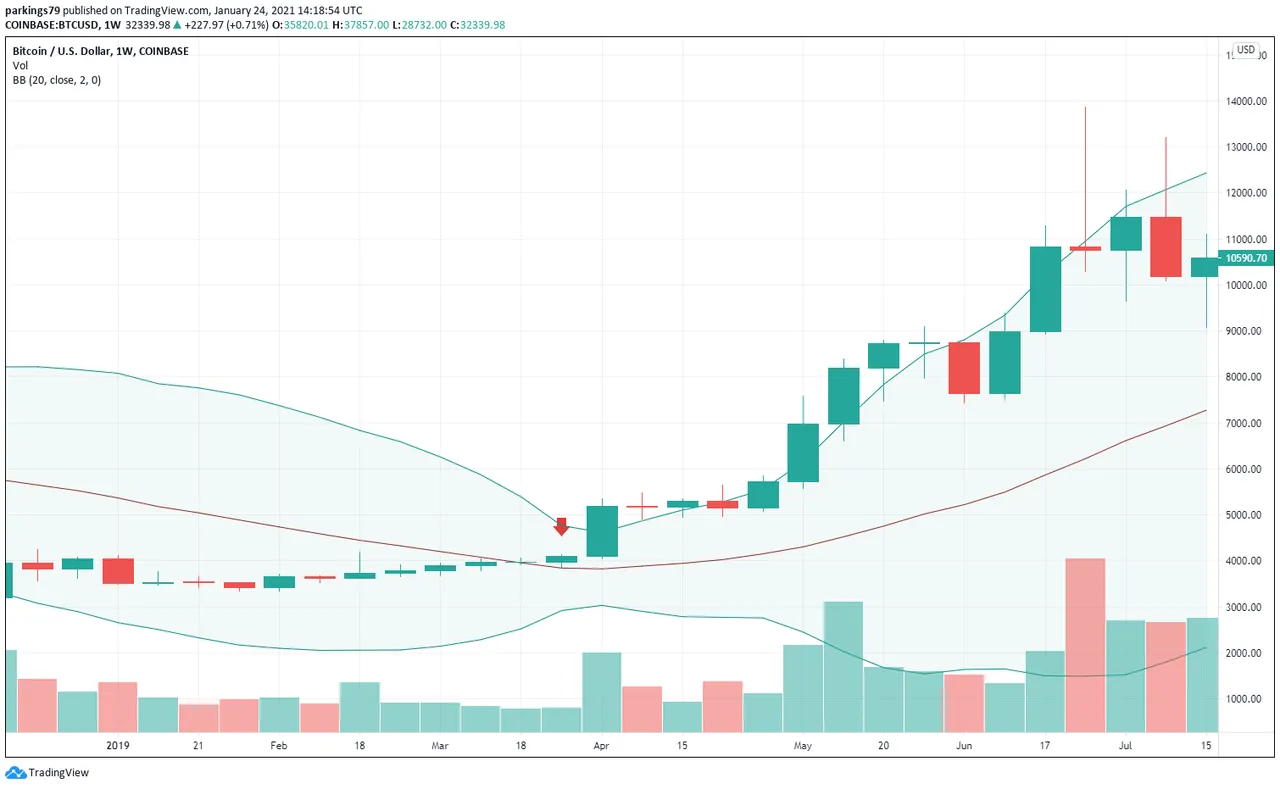
BTC 2019 March
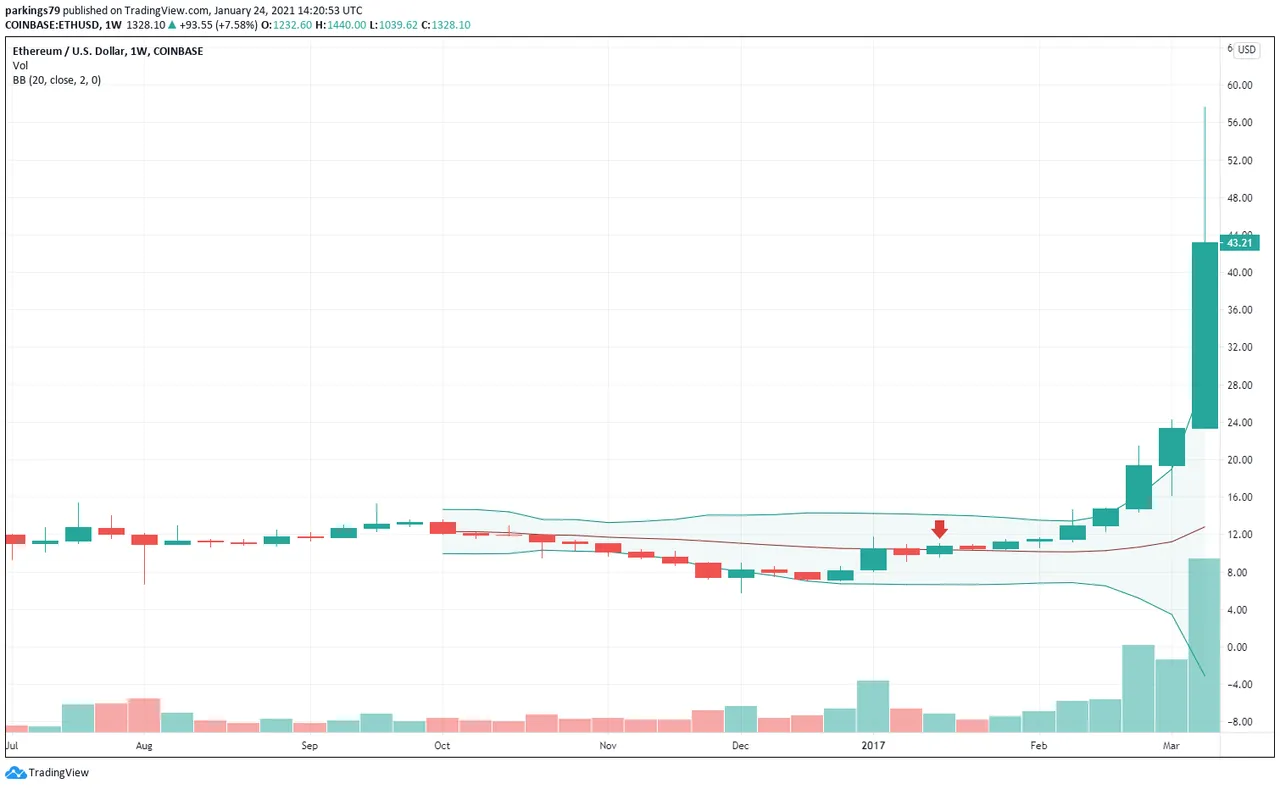
ETH 2017 January
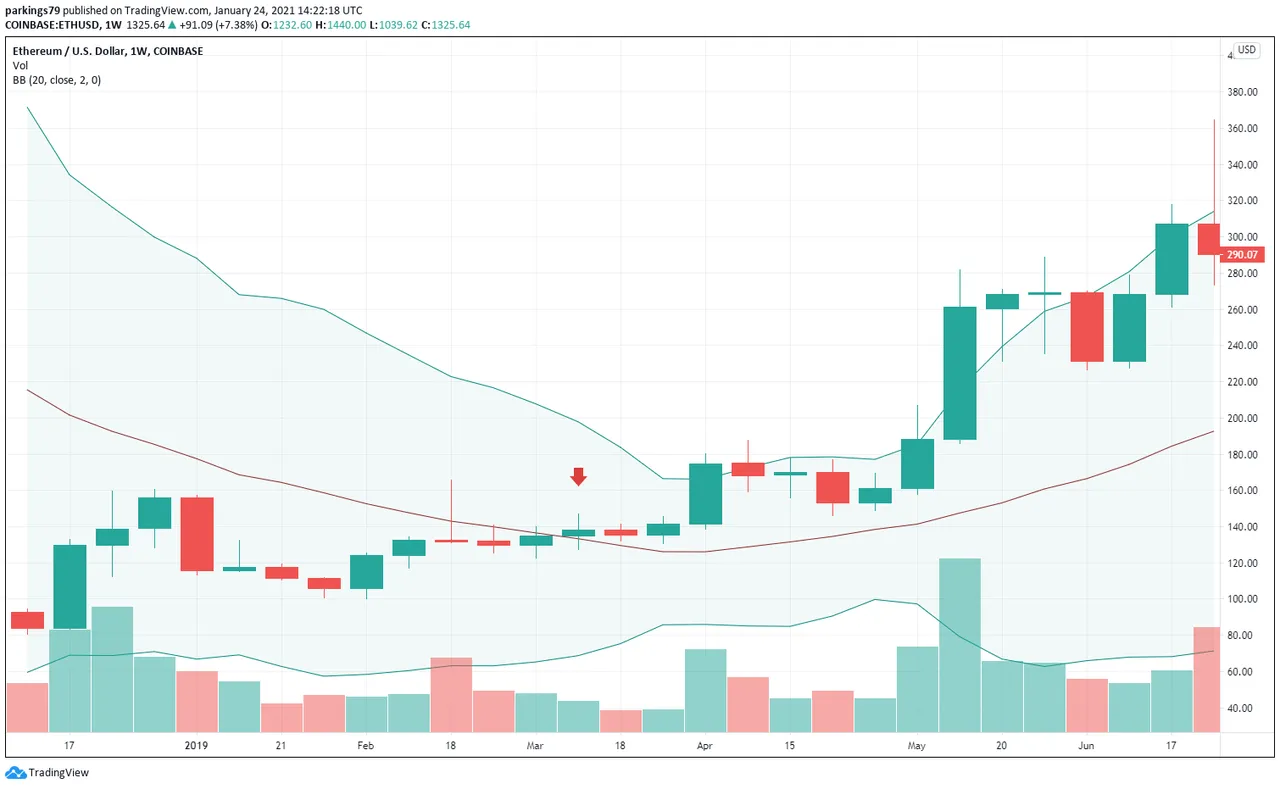
ETH 2019 March
If this result is correct, wouldn't it be the beginning of the rise of the Hive if it breaks through after today's closing?
I hope it will be helpful for you. HIVE, fighting!