
English Version
Well, a lot has happened since I did the last Bitcoin technical analysis, but we revisit the price action right now and update our view of the BTC/USDT market which is of utmost importance to the entire crypto world.
BTC/USDT
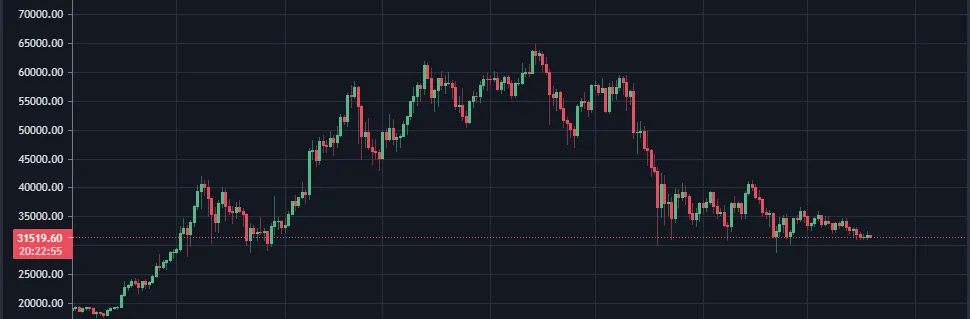
Doing an analysis in daily timeframe (1D) of the Bitcoin/ Dollar Tether pair. We can clearly notice the big pullback we have had in the value.
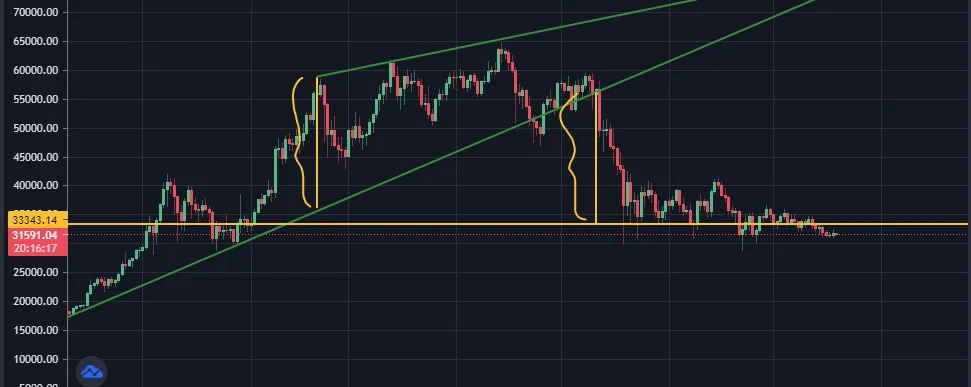
Months ago, when it was still around 57,000 USD it was inside a descending wedge that finally broke on May 12, and that had as a target (due to the wedge pattern mentioned above), the 33,500 USDT; which we can see in the following image, marked by the horizontal yellow line.
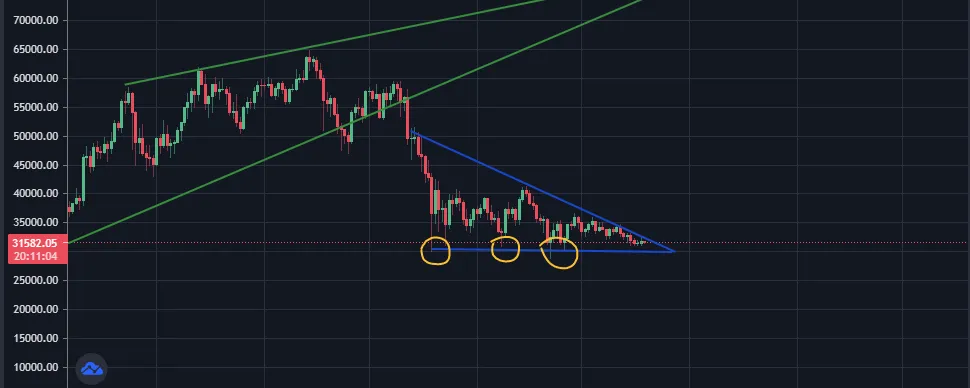
We can notice that since the day it reached that target and continued down to 30,000 USDT and until today has been forming a descending Triangular pattern (blue lines), where its support is around the area of 30,000 USD and that the asset has "tested" three times (yellow circles), without successful breakout, which makes this support is quite good and gives us the possibility to use it as Stop Loss (in case of intraday trading in BTC).
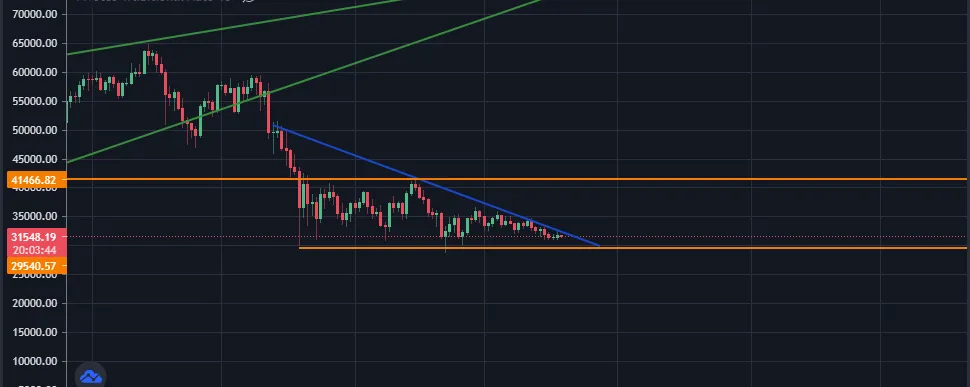
What I think, based on this how this support has behaved quite strongly in all these unsuccessful attempts of the bears (market selling force), if broken, that the price will end up bouncing soon to the upside, because it is running out of space inside the triangle, and will have as a closer target the 41,500 USD which is the upper horizontal yellow line in the following chart (being the lower yellow line the same support at 30,000 USD).
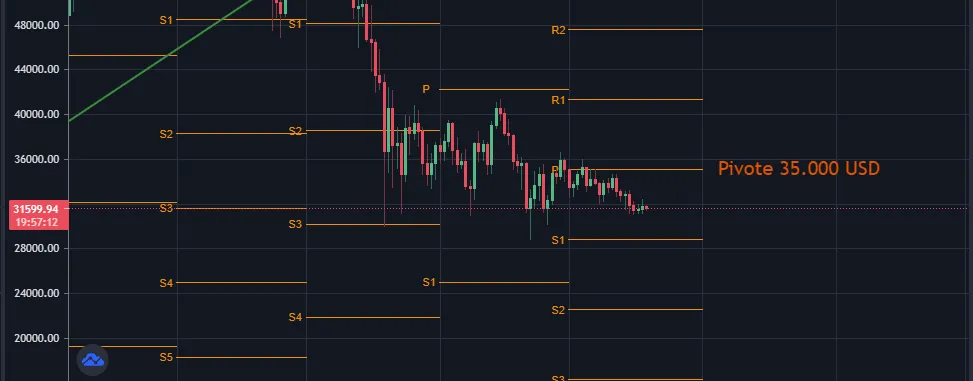
It is worth noting that although this target looks quite close on the chart, you also have to take into account the weekly pivot points (indicator that I like to use a lot) and that shows that the pivot point (marking a possible change of trend in the asset), is at 35,000 USD and is at this moment an important resistance that the bulls will need to overcome, in order to reach the target I mentioned before in the 40,000 USD area.
Based also on the MACD Indicator slowly approaching the neutral line area, this could mark a new change in the asset's price direction (now upwards), in the coming days or weeks.
Although we know, those of us who have been doing this for a long time, that we have to advance with caution, this could be a good opportunity to add some profit in the coming days.
We must always keep in mind the areas of support and resistance to be able to properly manage the risk in our operations (correctly set our T.Profit and S.Loss).

Versión Español
Bueno, mucho ha pasado desde que realicé el último análisis técnico de Bitcoin, pero volvemos a ver la acción del precio en estos momentos y actualizamos nuestra visión del mercado BTC/USDT que es de suma importancia para todo el mundo crypto.
BTC/USDT
Haciendo un análisis en temporalidad diaria (1D) del par Bitcoin/ Dolar Tether. Podemos notar claramente el gran retroceso que hemos tenido del valor.
Hace meses, cuando aun rondaba los 57.000 USD estaba dentro de una cuña descendente que finalmente rompió el día 12 de mayo, y que tenía como objetivo (debido al patrón de cuña antes mencionado), los 33.500 USDT; que podemos ver en la siguiente imagen, marcado por la línea amarilla horizontal.
Podemos notar que desde el día que alcanzó dicho objetivo y continuó bajando hasta los 30.000 USDT y hasta el día de hoy viene conformando un patrón Triangular descendente (líneas azules), donde su soporte ronda el área de los 30.000 USD y que el activo ha "testeado" tres veces (circulos amarillos), sin éxito de ruptura, lo cual hace de este soporte sea bastante bueno y nos de posibilidad de usarlo como Stop Loss (en caso de estar haciendo trading intradía en BTC).
Lo que yo pienso, en función de este cómo este soporte se ha comportado con bastante fuerza en todos estos intentos sin éxito de los osos (fuerza vendedora del mercado), de romperlo, que el precio terminará rebotando pronto al alza, debido a que se está quedando sin espacio dentro del triángulo, y tendrá como objetivo más próximo los 41.500 USD que es la línea amarilla horizontal superior en la siguiente gráfica (siendo la linea amarilla inferior el mismo soporte en los 30.000 USD).
Cabe destacar que aunque este objetivo parece bastante próximo en la gráfica, también hay que tomar encuenta los puntos pivotes semanales (indicador que me gusta usar mucho) y que muestra que el punto pivote (que marca un posible cambio de tendencia en el activo), se encuentra en los 35.000 USD y es en este momento una resistencia importante que los toros necesitarán vencer, para poder llegar al objetivo que antes mencioné en el área de los 40.000 USD.
Basandome también en que el Indicador MACD poco a poco se acerca a la zona de la línea neutra, esto podría marcar un nuevo cambio en la dirección del precio del activo (ahora hacia arriba), en los próximos días o semanas.
Aunque sabemos, los que tenemos tiempo en esto, que hay que avanzar con cautela, esto podría ser una buena oportunidad para sumar algo de profit en los próximos días.
Siempre debemos tener en cuenta las áreas de soporte y resistencia para poder realizar gestionar adecuadamente el riesgo en nestra operativa (establer correctamente nuestros T.Profit y S.Loss)
If you want to join Binance Exchange, click here and SIGN UP

If you are interested in belonging to the Erarium community (even if you only speak English), you can access our discord server here, where you will have access to more financial information and we can team up to make investments, trading and financial strategies.
In addition, you can follow us on our social networks, to offer you more interesting information about technical analysis, courses, personalized attention, airdrops, cryptocurrency bots and much more.
Si estás interesado en pertenecer a la comunidad de Erarium (incluso si hablas únicamente Ingles), puedes tener acceso a nuestro servidor en discord aquí, donde tendrás acceso a mayor información del tipo financiero y podemos formar equipo de trabajo para realizar inversiones, trading y estrategias a nivel financiero.
Además, puedes seguirnos en nuestras redes sociales, para ofrecerte más información interesante sobre análisis técnico, cursos, atención personalizada, airdrops, bots de criptomonedas y mucho más.
Sin más que agregar, me despido
ROCEJUMA