Namaste to all #Hive and #LeoFinance community members 🙏
Bitcoin is a digitized asset that is governed by rules enforced technologically and without relying on any central authority such as the government or banks; this is why, monetary policy, inflation rate, economic growth, etc. do not affect the price of a cryptocurrency.
Instead, its price is primarily affected by the following factors:
- The law of supply and demand.
- Other competing cryptocurrencies.
- News and Media.

Image by freepik | Edited on canva
But as per one important assumption of Technical Analysis and basic premise of the dow theory "The Market Discounts Everything". Meaning, all the information whether it is of past, present, or future is discounted in the market and reflected in the price of the instrument.
And that information includes everything from the psychology of market participants to all the news and development-related stuff. Meaning, that with the help of technical analysis, we can understand the price action better and make informed investment/trading decisions.
So without wasting any time let us now take a deep dive into the #bitcoin chart and see where it could be headed in the coming days.
Image by tradingview
In the above image, you can see the selection of the Bitcoin chart I picked for technical analysis on Tradingview
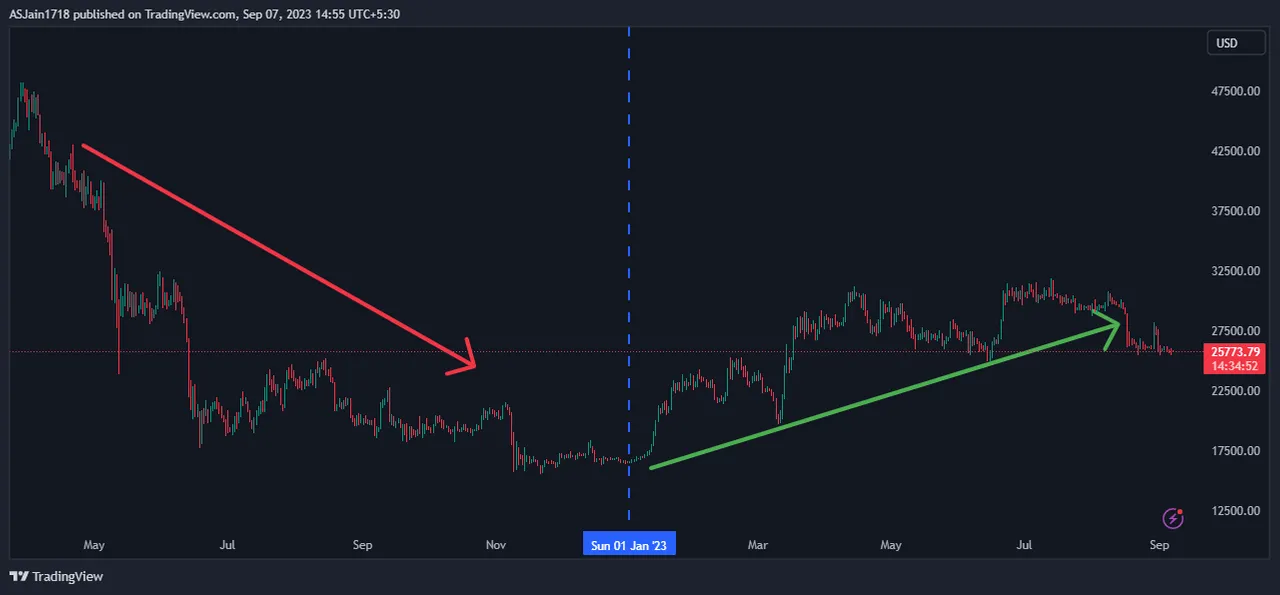
Chart Image by tradingview | Above is 1D time frame chart of BTC/USD (bitcoin)
The first and most noticeable thing in the above chart is that the price has clearly changed its trend from down to up. You can identify by looking at the left side of the chart where the price was moving in a lower-low trend till December 2022 and then from January 2023 it started moving in a higher-high trend.
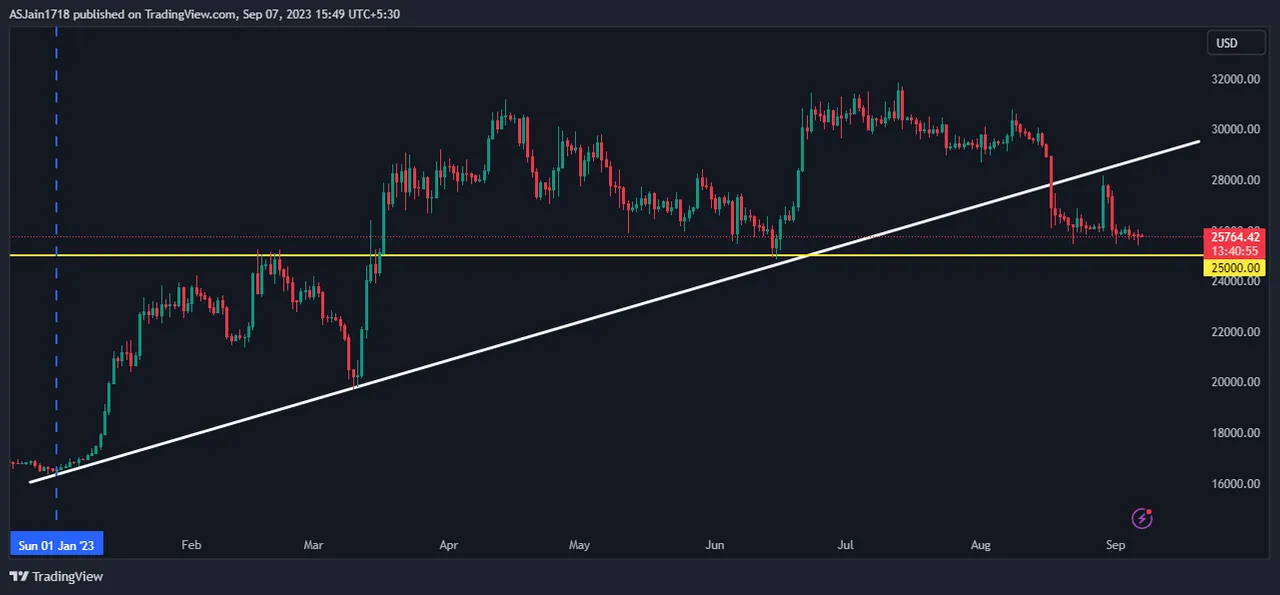
Chart Image by tradingview | 1 Day time frame chart of BTC/USD (Bitcoin)
In the image above you can see the same chart I have just zoomed in on the current trend highlighted by the bold white line. And a straight yellow support line that is not only psychological but also key technical support.
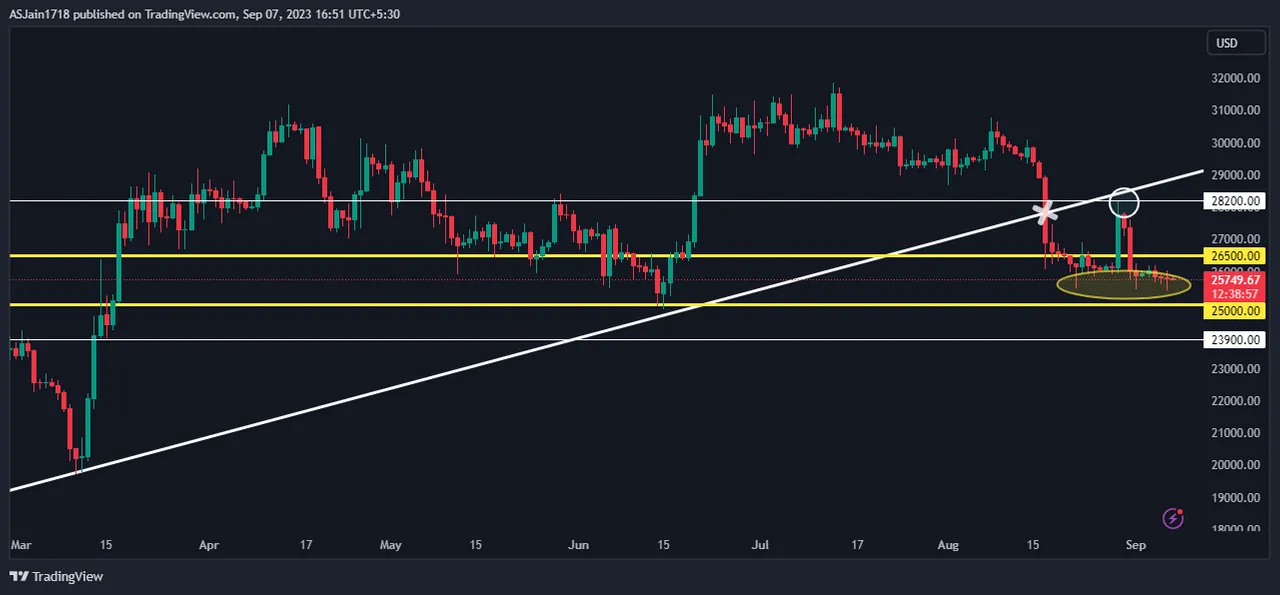
Chart image by tradingview | 1 Day time frame chart of BTC/USD (Bitcoin)
In the image above you can see the same chart again zoomed in a bit more on the current price action.
There are a few very important points to note in the chart here:
- Price has broken below the uptrend which is highlighted by a cross sign on the white trend line.
- We have also seen a big attempt by the buyers to drive up the prices, but the price could not hold up on the higher side which is highlighted by a little white circle, and as a result price has fallen down again.
- Also in the price action of the last two weeks, we can see continuous buying from the lower levels which we can see highlighted in the yellow ellipse area in the form of long lower wicks.
Now let's understand the strategy to trade Bitcoin next few weeks.
Firstly it doesn't look as strong as it did in its uptrend. Meaning above the white trendline. But right now it is traded near its previous swing low and a very important key support level of 25000. Also in the past few days, we've seen continuous buying from lower levels which signifies strength.
So, if we already have a buying position then we should hold on to it considering 25000 as a strong support. This means any candle that closes below 25000 will be considered as a sign of more weakness which can take it to 24450 and even 23900.
On the upside 26500 could act as an immediate hurdle. If the price sustained above 26500 then 27100, 27600, and 28200 could be the next levels on the higher side. Bitcoin may resume its uptrend above 28200 and our white trendline. Which can then take it to 28600, 29100, 29500, and 30100.
Now if you want to open a fresh position. Frankly, current levels are good for investing in bitcoin. As long as it is above 25000 it is safe. However, this level of 25000 is so obvious that considering it as support can also make your stop-loss hit. So, I would personally look at 24450 as an important support level or at least 2 daily candles close below 25000 following each other then I would consider that a break of our key support.