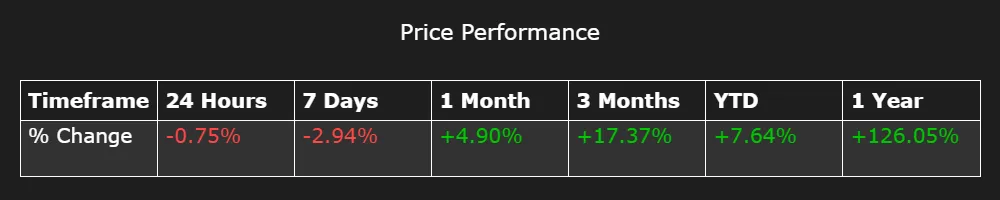
As we step into 2025, Bitcoin (BTC) continues to dominate the cryptocurrency landscape, showcasing both its resilience and volatility. With its current price hovering around $101,636.82, BTC has recorded a remarkable 126.05% increase over the past year, further solidifying its position as a leading digital asset.
However, the crypto market remains full of challenges. In this report, we will analyze the short-term, bearish trends, the neutral medium-term outlook, and the promising long-term bullish potential. Whether you're an active trader or a long-term investor, understanding these dynamics is crucial for navigating this ever-evolving market.
Let’s break down the key insights from this report and what they mean for the future of Bitcoin.
Disclaimer:
This report is for educational purposes only and should not be considered investment advice. Investing in cryptocurrencies carries significant risks, including the potential loss of your entire investment. It is essential to conduct your own research or consult a qualified financial advisor before making any investment decisions. Please note that this report has been generated for testing purposes, and the information contained herein has not been independently verified for accuracy.
Table of Contents
Executive Summary
1.1 High-Level Trends
1.2 Market SentimentBTC Price Performance
BTC Short-Term Analysis (1-3 Weeks)
3.1 Price Performance and Volume Analysis
3.2 Technical Indicators
3.3 Integrated InsightsBTC Medium-Term Analysis (1-3 Months)
4.1 Price Performance and Volume Analysis
4.2 Technical Indicators
4.3 Integrated InsightsBTC Long-Term Analysis (3+ Months)
5.1 Price Performance and Volume Analysis
5.2 Technical Indicators
5.3 Integrated InsightsConclusion
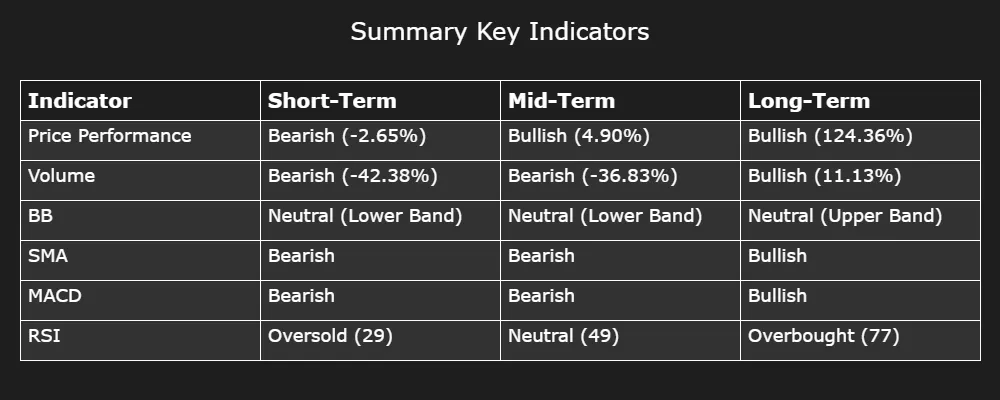
1. EXECUTIVE SUMMARY
Current price: USD $101,636.82
1.1 High-Level Trends
Short term: The short-term outlook for BTC is bearish, as evidenced by the negative momentum from the MACD and the fact that both SMA 5 and SMA 20 are above the current price, signaling downward pressure. The RSI is below the 30 threshold, indicating oversold conditions, yet this alone isn't enough to offset the bearish sentiment. The technical grade for the short term is negative.
Medium term: BTC's medium-term outlook is neutral. Despite the significant price appreciation, bearish indicators from the MACD and SMAs contrast with a neutral RSI, suggesting market stability but with a potential lean towards bearishness unless further bullish momentum develops. Therefore, the medium-term technical grade is neutral.
Long term: In the long term, BTC's outlook remains bullish. SMAs below the current price and a MACD showing positive momentum support an ongoing upward trend, although the RSI suggests the market might be slightly overvalued. The technical grade for the long term is positive.
1.2 Market Sentiment
BTC's overall market sentiment is shaped by a bearish short-term view contrasted with a neutral medium-term and bullish long-term outlook. While immediate selling pressures may persist, the longer timeframes indicate resilience and potential for continued growth. Investors should anticipate potential corrections due to the overbought indications while remaining optimistic about sustained long-term bullish momentum.
2. BTC Price Performance
BTC is currently valued at USD 101,636.82 (as of 19:59 01.02.2025), reflecting a decrease of 0.75% over the last 24 hours. Despite this recent dip, BTC shows significant growth in a broader context, with a 126.05% increase over the past year. The current market cap has reached USD 2.03 trillion, with a fully diluted market cap of USD 2.23 trillion, underscoring its robust market presence.
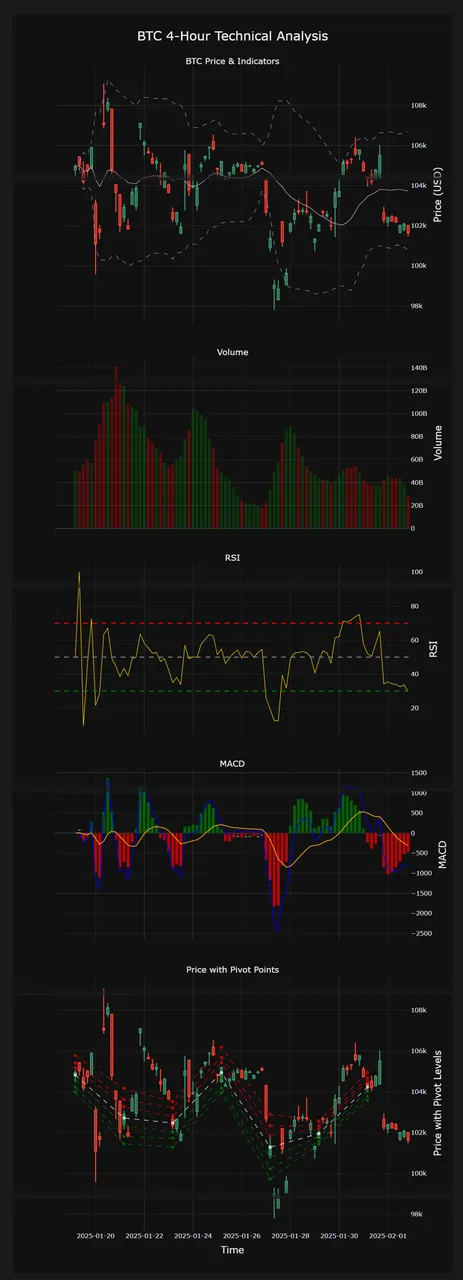
3. BTC Short-Term Analysis (1-3 Weeks)
This section focuses on the immediate outlook, suitable for active traders and those monitoring shorter-term price movements. Short-term price charts with hourly- and 4-hourly candles are used.
3.1 Price Performance and Volume Analysis
Price Movements: Over the analyzed period, BTC opened at $104,780.17 and closed at $101,636.82, resulting in a -3.00% change. The price fluctuated, reaching a low of $97,795.94 and a high of $109,094.99.
Support and Resistance Levels: The chart indicates potential support around S1, S2, and S3, and resistance around R1, R2, and R3. The current price below key resistance levels suggests limited upward momentum unless these levels are breached.
Trading Range: BTC traded within a range from approximately $97,795.94 to $109,094.99 during this period.
Volume Trends: Volume trends indicated increased selling pressure, especially during price declines, signifying negative investor sentiment and suggesting a bearish outlook in the short term.
3.2 Technical Indicators
Bollinger Bands: The price hovered near the lower Bollinger Band edge, indicating potential oversold conditions. The narrowing bands suggest reduced volatility in the short-term, pointing towards a stable market.
Simple Moving Averages: Both SMA 5 and SMA 20 are above the current price, indicating bearish short-term trends. This suggests potential downward pressure unless crossed upwards.
MACD: The MACD line remains below the Signal line, with a negative histogram showing. This signals negative momentum, suggesting a sell entry continues to prevail.
Relative Strength Index (RSI): The RSI is at 29.71, below the 30 threshold, indicating oversold conditions. This suggests the market may be undervalued temporarily, potentially priming for a corrective bounce.
3.3 Integrated Insights
The overall technical analysis presents a negative sentiment given the bearish indicators. The RSI's indication of oversold conditions slightly conflicts with the bearish MACD and SMA trends. While short-term downward pressure persists, there may be opportunities for bounce-back momentum if market conditions allow for a technical recovery from oversold positions. However, the short-term outlook remains bearish unless key resistance levels are surpassed or indicators show upward signals.
4. BTC Medium-Term Analysis (1-3 Months)
This section provides insights for swing traders and medium-term investors seeking a balance between short-term volatility and longer-term trends. Analysis is conducted predominantly on daily price charts.
4.1 Price Performance and Volume Analysis
Price Movements: Over the medium-term period, BTC's price increased from $69,296.38 to $102,405.03, marking a significant appreciation of approximately 47.78%. This upward trend demonstrates strong bullish momentum throughout the period.
Support and Resistance Levels: Recorded support levels are notably below the current price, with resistance levels approaching and crossing the $100,000 mark. With the current price sitting at $102,405.03, the potential to test new resistance levels may indicate further upside if market sentiments remain strong.
Trading Range: BTC traded within a wide range of $66,803.65 to $109,114.88, reflecting substantial volatility during the period. This range suggests active market participants and trading opportunities.
Volume Trends: Trading volume exhibited several peaks with higher activity around notable price movements. Consistent volumes suggest balanced trading activity with a neutral to positive investor sentiment indicating sustained buying pressure.
4.2 Technical Indicators
Bollinger Bands: The price fluctuated between the upper and lower Bollinger Bands, with several instances of touching the upper band demonstrating heightened volatility. These touches indicate potential overbought conditions. However, recent stabilization towards the median band may lead to a stable market condition in the next 1-2 months.
Simple Moving Averages: Both the 10-day and 20-day SMA values are slightly above the current price, presenting a bearish signal. The short-term trend appears to be leaning towards bearishness unless a crossover occurs.
MACD: The MACD line is below the Signal line, indicating negative convergence and bearish momentum. The downward-sloping histogram reflects bearish momentum, suggesting a sell entry unless a bullish crossover occurs.
Relative Strength Index (RSI): The RSI level hovers around 49.20, firmly within neutral territory, implying no current overbought or oversold conditions. This level indicates balanced momentum and a stable market with terms potentially undervalued or ready to rise as other conditions change.
4.3 Integrated Insights
The overall technical indicators suggest a neutral market outlook. Despite the strong price increase, bearish signals from the MACD and SMAs contrast with the neutral RSI, reflecting conflicting sentiments. With persistent buying pressure seen in volume data, the market sentiment currently remains positive with potential correction phases ahead. The next 1-3 months forecast a neutral outlook for BTC, but closer observation of support levels and reversal signs could alter this sentiment to bullish if positive momentum strengthens.
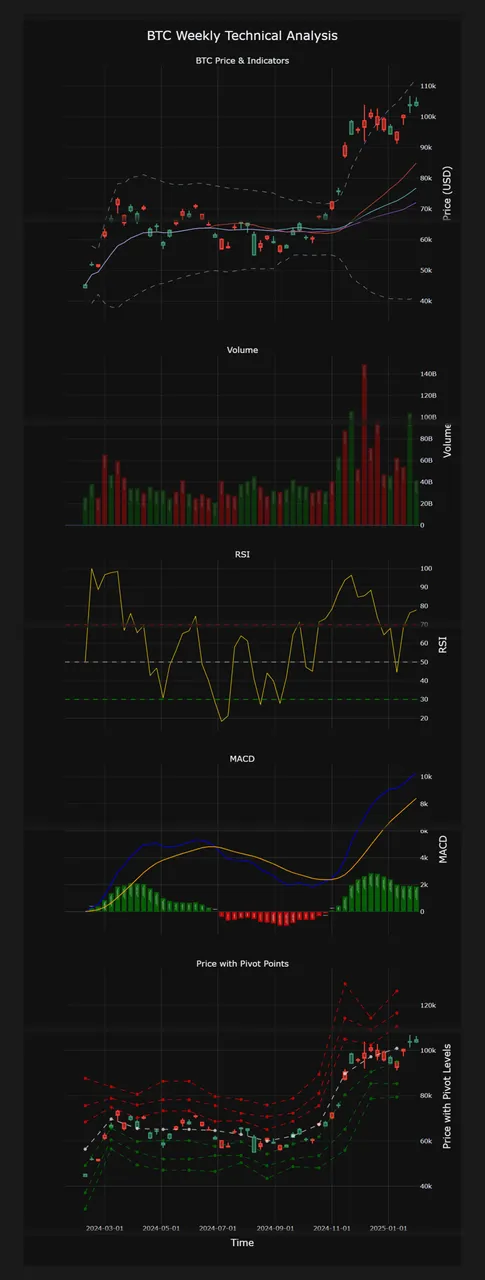
5. BTC Long-Term Analysis (3+ Months)
This section addresses the longer horizon, ideal for investors looking at broader trends and underlying momentum. Analysis is conducted predominantly on weekly price charts.
5.1 Price Performance and Volume Analysis
Price Movements: Over the past year, BTC has shown an upward trajectory with a noticeable increase in its value. The current price sits at approximately $90,000, reflecting a substantial yearly change of +126.05%. This indicates a strong bullish trend.
Support and Resistance Levels: There are three main levels of support and resistance. The price has consistently broken through previous resistance levels, indicating a strong potential for continued upward movement. This bullish sentiment suggests rising potential if these levels hold firm.
Trading Range: BTC has traded between $40,000 and $90,000 in the past year, showing considerable volatility yet an overall bullish trend. This broad trading range demonstrates the strong market interest and speculative activity around BTC.
Volume Trends: Trading volume has shown periods of high activity, particularly during price peaks. This suggests strong buying pressure, indicative of positive investor sentiment and the expectation of continued price rises.
5.2 Technical Indicators
Bollinger Bands: The price frequently touches the upper band, indicating volatility and potential overbought conditions. This suggests the market may be slightly overbought, but the condition remains broadly stable for the next quarter.
Simple Moving Averages: All SMAs (20, 30, 50) are positioned below the current price, reinforcing the bullish trend. The SMA values support ongoing price strength and a positive long-term trend.
MACD: The MACD line is above the Signal line, reflecting positive convergence. This crossover signals a bullish momentum, with trends in the histogram supporting this outlook. A buy entry signal is evident.
Relative Strength Index (RSI): The RSI stands at 77.73, placing it in the overbought territory. This indicates strong bullish momentum, though the market might be slightly overvalued.
5.3 Integrated Insights
The technical indicators collectively suggest a technically positive market sentiment. The bullish RSI and MACD reinforce the ongoing upward trend, although the overbought conditions highlighted by the Bollinger Bands and RSI suggest caution.
Overall, the long-term outlook for BTC appears bullish, considering the momentum across most indicators. Investors should be aware of the potential for price corrections but can remain optimistic about continued growth given the present trends.
6. CONCLUSION
In the short term, BTC exhibits bearish tendencies, with price movements restrained below key resistance levels and indicators such as the MACD and SMA signaling negative momentum, although RSI suggests potential for short-term corrective bounces due to oversold conditions. Moving into the medium term, there is a neutral outlook as recent gains meet resistance from bearish technical indicators, balanced by positive market sentiment which could alter the trend if momentum strengthens. In the long run, BTC demonstrates strong bullish potential, with a yearly increase of over 126% and technical indicators like SMA and MACD supporting sustained growth, though caution is advised due to possible overbought conditions as indicated by the RSI. Overall, while short-term caution is necessary, the medium to long-term outlook provides optimism for upward trends, with potential price corrections serving as strategic entry points for investors.